< Back to A level Cheat Sheets
A Level HUMAN Geography (Paper 2)
⚠ This is a work in progress, unfinished document (more so than the other physical side). The most unfinished sections are marked with [tbd] and there may be general issues and typos. ⚠
please let me know if there are any errors :)
Latest update: 15/07/2023 11:06.
Last content addition: 07/06/2023 23:16.
✅ Note: This file is synced with this repository. This is the latest version.
Use a PC/device with a large screen to see the Table of Contents on the left-hand side to quickly navigate through this document.
Discuss with other students, developers, educators and professionals in the Baguette Brigaders Discord server! You can also receive a notification when there are new Cheat Sheets, Summary Sheets (new!) or other revision material is made public there!
For the entire specification, you can go here.
For only the physical geography (paper 1), you can go here.
[TBD] Global Migration
Page 30 in the OCR A Level Geography H481 Specification or search for: ‘Global Systems: Option B – Global Migration’
A migrant is …
Interdependence - interrelationships between ACs, EDCs ans LIDCs through trade, foreign aid and migration
Globalisation - the growing integration and interdependence between peoples’ lives economically, politically and environmentally.
[TBD] 2.1 – Changing Spaces; Making Places
What’s in a place?
Key idea:
1.a. Places are multi-faceted, shaped by shifting flows and connections which change over time.
Content:
Case studies of two contrasting place profiles at a local scale, including:
- their demographic, socio-economic, cultural, political, built and natural characteristics that shape their place identity.
- their past and present connections that shape the place identity and embed them in regional, national, international and global scales
- how shifting flows of people (such as commuter, migration), resources (such as natural, technology), money and investment (such as EU funding, TNCs) and ideas (such as knowledge economy) have helped shape the demographic, socio-economic and cultural profile of these places over time.
A place can be described as a location created by human experiences.
A space, on the other hand, has no added social connections or added perceived values.
For example, a car parking space at a shopping market has no value to you. It’s just a one time location which you leave your car at. However, a parking place at your work may have your name on it, it may be valued by yourself and there may be some memories associated with it, such as tripping over or talking to someone there.
One person’s place may be another’s space.
Places can have different connections and perceptions. These are also likely to change over time. For example, 10 Downing Street may be perceived by characteristics, such as being a centre for political power, socioeconomic decisions or even for Larry the Cat who’s there. It also has many factors which determine how people perceive it, such as the current political affiliation or recent decisions made by the people inside.
Place Identity is a combination of many characteristics that comprise a place. These factors include:
- socioeconomic (housing tenure, employment, income)
- political (national and regional government)
- cultural (religion, traditions, societies)
- physical (altitude, geology, proximity to natural features like rivers)
- demographic (ethnicity, age, gender)
- the built environment (building materials, ages, density)
Places are multi-faceted, shaped by shifting flows and connections which change over time. This can be seen with Canary Wharf, which is now a hub for businesses, bing banks, trade and commerce. It was part of the London Docklands, which became gentrified after the decline of the shipment industry. Flats were demolished and rebranded from old, contaminated stockhouses to new entrepreneurial small businesses and now high-rise, technologically advanced buildings coupled with bars, cafés and waterside views, giving it a sense of identity. To the people who work there or go there regularly, this is a place, not just a space.
Case study: Place Profile - Mancroft Ward, Norwich
A ward is an administrative region of a city or borough, electing its own councillor.
Physical Geography
Norwich is located on the River Wensum, flowing through the city. It is surrounded by many rivers and tributaries like the Yare and Waverley. These rivers have played an important role in the development of the region and city, both for industry and for transport. The geology is mostly composed of sandstone and chalk, used historically in the buildings, being durable. This style has been seen in the castle, while flints are used in many of the churches.
Political
Norwich is governed by Norwich City Council. The city has 39 city councillors, with 13 electoral wards, each having three councillors who undertake casework for constituents, making council policies, budgeting and service delivery. The county council runs education services as well as social care and transport.
Bonus info: the Russell Street Community Area Residents Association is a group of people within the Mancroft Ward who discuss local issues such as litter, tackling homelessness and lonliness, meeting monthly, and using platforms like Facebook to communicate to make the area more pleasant to live in.
May 2022 Council Election Results. Turnout 35.3%
| Candidate Name | Political Party | Votes | Elected |
|---|---|---|---|
| Carrington Jess | Labour and Co-operative Party | 691 | |
| Dean Gordon Richard | Liberal Democrats | 55 | |
| Gwynn Iain Michael Morgan | The Conservative Party Candidate | 243 | |
| Osborn Jamie | The Green Party | 1,606 | X |
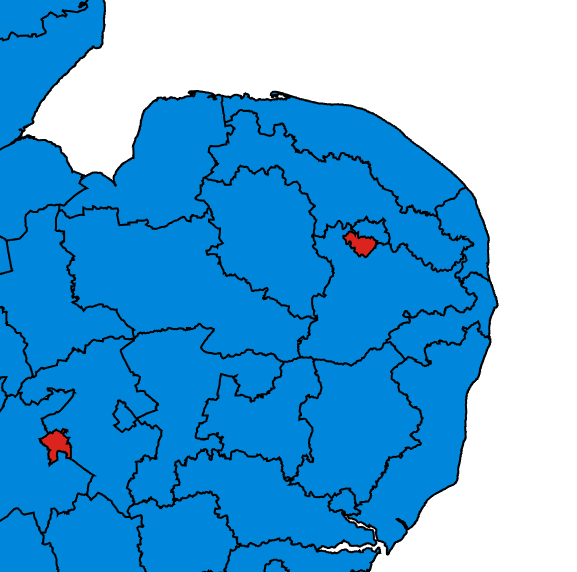
Mancroft is part of Norwich South for general elections. In 2019, it was one of two districts to vote Labour in the East
Built Environment
Mancroft is home to a variety of architectural styles and ages, ranging from the 15th century to the modern day. Examples of 15th century buildings include the Guildhall, whilst 19th century developments include the Royal Arcade. The skyline is generally low-rise. The
The ward also contains two modern, innovative shopping centre developments, Chantry Place and Castle Quarter. Furthermore, The Forum is a modern development in amongst the 499 listed buildings. Very diverse, e.g. Norwich Market with various stalls from tearooms, army equipment, Italian street food to Indian scents and spices - reflecting the diversity of the ward (and city as a whole!) and demands for these foods. The ward’s population density at is also 10 times the UK average, having approximately 5,000 homes.
History
The ward itself is named after St Peter Mancroft alongside the parish church. There are two cathedrals and a castle in the city, one of which is in the ward, which itself is very rare across the UK. The name originated from the Latin term “Magna Crofta”, or “Great Field”. It used to be the second largest and most important city in England before industrialisation occurred. There was a strong trade bond with the Netherlands through the River Wensum, which extends out into the North Sea that allowed for easy boat transport. To this day, some of the city’s walls which surround this area are still in good shape thanks to their listed status such as Cow Tower and Black Tower.
Demography
2021 population:
- 10,618 people. 2.012km2 with 5,252 people per km2.
- Annual population change is 3.2%, from 2011 to 2021.
- There are 10 more males than females at 5,313 men, showing a very even distribution.
- 84.4% white, 6.8% Asian, 3.3% black, mixed race 3.5%
- 77% of the population originated the UK, 23% were foreign born residents, of which 9.9% are from EU countries.
- The highest population in age distribution bracket is 20-29 years, which contains 2,740 people
Least religious city in the UK! with 57.8% saying they have no religious affiliation! Christianity is still the second most popular, and Islam is third at 33.5% and 3.5% respectively.
Socio-economic
Mancroft is categorised as a built-up area alongside most of Norwich by the ONS. Large amounts of flats, apartments in a close proximity suggests that there are many employers and jobs available within the region and city, so employees can easily access these facilities.
11% of the ward are retired and therefore less economically active. There are also 866 students and the most will be paying rent and working, contributing to local economy. There are 5353 economically active people, while there are 2466 economically inactive residents.
Furthermore, the average income is £32,000, showing that there are many professional jobs being occupied. This means that there is a reasonable amount of disposable income for residents to spend on facilities and more recreational activities, such as supporting local cafes which tend to be at a higher price.
The majority of homes have 3-4 rooms, (not just bedrooms), suggesting that the majority of people in the area are either single or in a relationship without children. There are 5708 homes in total, with 3188 people living alone. This data implies that there are many workers living in smaller, urban dwellings. When families are formed, they then go on to move away from the inner city area and potentially to more suburban areas outside of Mancroft.
These statistics reflect the average “life progression”, with people working in inner city jobs or are students during thier early 20s due to work facilities available, nightclubs and nightlife (being more ‘adventurous’), but then settle in a more comfortable job and have families, moving to more remove areas with a larger house to take care of children.
Summary:
Overall, Mancroft is a built-up area with a high population density, suggesting that it contains a large amount of flats and buildings in close proximity. The population is diverse, with 11.07% of the ward being retired, 866 students, 5,353 economically active people aged between 16 and 74, and 2,466 people economically inactive. The majority of homes have 3 or 4 rooms, with an average of 2.51 people per household, suggesting that the area is mainly occupied by single people or very small families. This data implies that Mancroft is a roughly working to lower middle-class area (also inferred by its political affiliation) with many workers living in smaller houses, and families would then go on to move away from this area in the city centre with increased affluency and more likely to be middle-class.
Case study: Place Profile - Sheringham North Ward, North Norfolk
Physical Geography
Sheringham is situated on the North Norfolk coast. One of the highest points in Norfolk is located in western Sheringham, known as the “Beeston Bump” locally. It is 73 metres high and is made up of old glacial moraines dating from the end of the Pleistocene epoch eround 11 to 13,000 years ago, when northern advancing glaciers retreated. It is made out of sand, gravel and stones.
For this reason, and the proximity to the coast, it was used to protect the homes behind it, being less prone to erosion from the sea due to the increased mass to erode. There also used to be two villages behind this bump, which have now merged into one larger conurbation. (It used to be two roughly symmetrical hills that has now merged into one, just like the conurbation!).
The coastal cliffs in the area are made of sedimentary rocks such as chalk, clay and flint, which have provided the region with building materials and is why there are many small cottages or other buildings in the area made of flint.
There’s also a lot of prominent erosional processes and westwards longshore drift, resulting in sandy beaches and the necessity of groynes on the beach to maintain this sand.
Political
Sheringham is part of North Norfolk in general elections. In the 2019 general election, 58.6% of the vote was Conservative (up from the UK average of 43.6%) , which was a gain of 16.9% of the vote since the previous year’s election.
The Labour Party made up just 7.7% (compared to 32.1% in the UK) and the Lib Dems made up the second largest party at 30.3%, with a respective decline of 2.2% and 18.1%. 58.9% of North Norfolk, which included Sheringham, voted to leave the European Union in 2016. The MP, Duncan Baker, was a member of the UKIP party before the Brexit campaign.
Built Env
Flint is the most common and naturally abundant material in Norfolk, particularly for the building of cottages. This is especially pronounced in coastal areas such as in Sheringham North Ward. It is also an iconic material for tourism, as well as typically costing more to use than bricks and also looking good on postcards!
History
It was ‘created’ in 1086. The land was owned by William d’Ecouis. The Domesday entry lists public land, slaves, farm animals, churches and more in modern-day Sheringham.
In the late 1800s it was a major crab and lobster fishing centre and supplied London markets using new railway routes brought about from industrialisation from the 200+ fishing boats and companies which regularly went out from the port at this time. Many large business owners who had lots of money to spend, especially during the industrialisation period, bought large mansions or constructed their own buildings in the area, which created a snowball effect with other businessmen
It continued to be popular for particularly more wealthy and affluent people as holidays throughout the 20th century. From the 1950s and up onwards it has continued to attract elderly people for retirement due to its peaceful and serene atmosphere as well as having good coastal views and sufficient amenities.
Demography
In Sheringham North, the population in 2021 during the last census was 2,470. 98.1% of the population were white British. There were only four black residents.
The highest population age distribution bracket was between the 70 and 79 years age range with 464 people. Furthermore, 39.4% of the entire population are aged above 65. Just over half, at 50.8%, are between 15 and 64 years old. Of this total, 95% come from the UK.
The population has actually decreased from 3002 in 2011.
Socio-economic
In Sheringham North, there are 622 households with one person with a serious health condition, meaning that they cannot work. There are 64.7% of men who are economically active, compared to 59.6% of women economically active, meaning that 35 and 40% of them are inactive in the economy, respectively. 29.66% of people are managers, directors or senior officials and in professional occupations.
This shows that there may be an upcoming problem for the council and town planners as these older people continue to age, more accessible features will have to be put in place to support them.
Average costs for a terraced house are £223,500 to £312,500. For a semi-detached house, this is £250,000 to £364,500. A detached house costs typically over over £400,000.
Comparisons
Sheringham has a much older demographic with an average age of 51 years compared to 37 in Mancroft. This may result in more services like bingos and buses, with less schooling in Sheringham. Sheringham may also be less reluctant to change, not only because of the older population who are typically less accepting of new ideas and visions, but the people living there may spend more time retired compared to the lower, younger, more accepting population like students who may only spend 2-3 years in the area, who may be less inclined to travel further away to places such as Cromer to get their shopping done as they do not have as much time as the older, retired population.
[Dev Note 3/6/23] Possibly add more comparistions and their impacts on place identity here.
Shifting flows of money, investment and ideas on place identity
Norwich first started as a Saxon marketplace in the 800s and 900s, exporting wool. Throughout the Middle Ages, it was England’s second largest city.
During the Industrial Revolution, there was a large amount of rural to urban migration who powered new industries such as the mustard and chocolate factories.
It became a centre for textiles and shoemaking until the early 1900s. The ex-largest insurance company, Aviva, or Norwich Union, was established in the 16th century and then proceeded to go global.
It was relatively isolated until the railway arrived in 1846. It was faster to go to Amsterdam by boat than travel to London.
Since then, it has had a complete revolution. Norwich is now the eighth most prosperous shopping location in the UK, with old-fashioned industrial buildings and factories being redeveloped and gentrified into new places such as Riverside, Castle Quarter, and Chantry Place.
There has been a constant flow of students and academics in the area, fuelled by the UEA, which has close connections to world-renowned Cambridge Universities. The UEA also houses the John Innes Centre, which has provided global breakthroughs in the fields of biology and sciences, and Tyndall Centre for Climate Change, equally as significant. This has transformed the economy into a quaternary knowledge economy, supporting high-tech and scientific quaternary sector jobs, comparing to around 250 years ago, when it was just primary and secondary sector hub, involving large amounts of manufacturing and farm labour.
Norwich is a commuter town too, with people coming into work from surrounding villages, and good transport links with goods moved into Norfolk via the M11 and A14. This has continued to attract investment by transnational corporations.
Shifting flows of people
At the heart of it, people are what turn a space into a multifaceted place. The exact stage in people’s lives determine and influence where people live. For example, the location and housing tenureand house type, and by extent, the place profile.
The local availability of a resource or natural advantage can encourage the growth of a settlement and mould its identity by fuelling industry. If these resources run out or global shift occurs for a particular product, technology typically takes over the natural advantage and the place profile can and often change. In Norwich for example it has become cheaper and easier to manufacture goods like shoes and chocolate overseas and import it thanks to globalisation leading to the replacement of local resources. Ocean going ships have grown significantly in size and can no longer fit up the River Yare so the riverside docklands fell into decline, much like the London Docklands.
How do we understand place?
Key Ideas
a) People see, experience and understand place in different ways, this can also change over time.
b) Places are represented through a variety of contrasting formal and informal agencies.
Content A:
- The complexities that exist when trying to define place, including the concept of space versus place.
- How and why people perceive places in different ways based on their identity, including age, gender, sexuality, religion and role.
- How level of emotional attachment to place can influence people’s behaviour and activities in a place.
- How the processes of globalisation and time-space compression can influence our sense of place.
Content B:
- How informal representations of a place differ through contrasting media such as TV, film, music, art, photography, literature, graffiti and blogs.
- Identify how formal and statistical representations of a place, such as census and geospatial data, contrasts with informal representations.
Place Perception: Uluru and Jerusalem
Emotional attachment: The Kurds and Kurdistan
Globalisation and our sense of place
Economic change and patterns of social inequality
Specification content:
3. How does economic change influence patterns of social inequality in places?
3.a. The distribution of resources, wealth and opportunities are not evenly spread within and between places.
- The concept of social inequality and how this can be measured through indices such as housing, healthcare, education, employment and access to services.
- How and why spatial patterns of social inequalities vary both within and between places.
3.b. Processes of economic change can create opportunities for some while creating and exacerbating social inequality for others.
- The influence of global connections and globalisation in driving structural economic change in places, such as de-industrialisation and the rise of the service industry.
- How structural economic change impacts patterns of social opportunities and inequality for people and places.
- How cyclical economic change (booms and recessions) has varied impacts on social opportunities and inequality.
- The role of government in reducing, reinforcing and creating patterns of social inequality in places through spending or cuts in key services such as availability and accessibility of education, healthcare, infrastructure and community services.
3.c. Social inequality impacts people and places in different ways.
- Case studies of two contrasting places to illustrate:
- the types of evidence of social inequality that can be found there such as housing, environmental quality, crime rates, digital divide
- the range of factors that influence people’s social inequality such as income, gender, age, health, personal mobility, ethnicity and education
- how social inequality impacts upon people’s daily lives in different ways.
[TBD] Measuring Social Inequality
Book reference: pages 158-162
The Gini coefficient is used to measure the inequality of income and thereby deprivation within countries. Here is the UK stats on the ONS website.
Players that impact on economic change
Specification content:
4. Who are the players that influence economic change in places?
4.a. Places are influenced by a range of players operating at different scales.
- The role of players in driving economic change, including at least one of local and national government, MNCs or international institutions.
- Case study of one country or region that has been impacted by structural economic change, including:
- socio-economic, demographic, cultural and environmental characteristics of the place before the economic change
- the economic change/changes that took place and the role of players involved in driving the change
- socio-economic, demographic, cultural and environmental impacts on people and place.
Placemaking processes
Specification content:
5. How are places created through placemaking processes?
5.a. Place is produced in a variety of ways at different scales.
- The concept of placemaking and how governments and organisations attempt to present places to the wider world to attract inward investment and regeneration.
- How architects and planners attempt to create meaningful and authentic places through design, such as places that encourage mixed community use or the 24 hour city.
- How local community groups shape the place they live, such as residents associations, heritage associations and social media
5.b. The placemaking process of rebranding constructs a different place meaning through reimaging and regeneration.
- Why places rebrand through reimaging and regeneration to construct a different place meaning.
- How a range of strategies can be used to rebrand places, such as sport, art, heritage, retail, architecture and food. These can be used singularly or in conjunction to change a place meaning.
- A range of players and their role in placemaking, including government/EU funding, corporate bodies, not for profit organisations and community groups.
- How and why some groups of people contest efforts to rebrand a place.
5.c. Making a successful place requires planning and design.
- Case study of one place that has undergone rebranding, including:
- why the place needed to rebrand
- strategy/strategies involved in the rebranding of the place
- the role and influence of a range of players involved in the placemaking
- how the rebranding has altered people’s perception of that place
- the relative success of the rebranding.
end of paper 2
NEA stuff
Spearman’s Rank
In the first sheet, in cell E5, you write:
=RANK.AVG(C5,$C$5:$C$24,0)
This compares the value of the cell in C5 to those in cells 5 to 24.
You then go to the bottom right of the cell and drag the dot to cell E24
This will copy that earlier formula to give the results for each row. This is because we need the results in an ordered format.
Repeat this for the Cancer rate column (so =RANK.AVG(D5,$D$5:$D$24,0)) in column F
Finally, in any other cell, we can use the cool excel CORREL function to just work it out
=CORREL(E5:E24,F5:F24)
This gets the spearman’s correlation for the two sets of data
Footnotes
(Disclaimer) AI-assisted writing
ChatGPT or any other text-based generative transformer model was not used to directly write the content here. It’s good for clarification of certain topics (and I’ve used it for that), but don’t get used to it otherwise you’ll lose your creativity.