< Back to A Level Cheat Sheets
A Level OCR Geography: Complete Cheat Sheet
⚠ This is a work-in-progress, unfinished document. The most unfinished sections are marked with [tbd] and there may be general issues and typos. ⚠
please let me know if there are any errors :)
Latest update: 02/06/2024 22:33
Last content addition: 02/06/2024 22:33
License: CC BY-NC 4.0 - you may use this in your own work, but a link to this resourse and author acknowledgement must be given. please click the link for the full legal deed.
You can use a PC/device with a wide screen to see the Table of Contents and quickly navigate through this document.
Discuss with other students, developers, educators and professionals in the Baguette Brigaders Discord server! You can also receive a notification when there are new Cheat Sheets, Summary Sheets (new!) or other revision material is made public there!
NEW! You can also follow iBaguette on Instagram for updates and new Cheat Sheets, study memes and clips, revision tips, and more!
Top-notch graphic design by me
Let’s get right into the content!
Paper 1 - Physical Systems
1.1 Option B – Glaciated Landscapes
“Feeling a little like a drumlin today.”
Check out this interactive ARCGIS British ice map to see places in the UK which have been influenced by glacial activity, with drumlins, subglacial lineations, moraines and more!
Glaciers as Systems
1.a. Glaciated landscapes can be viewed as systems.
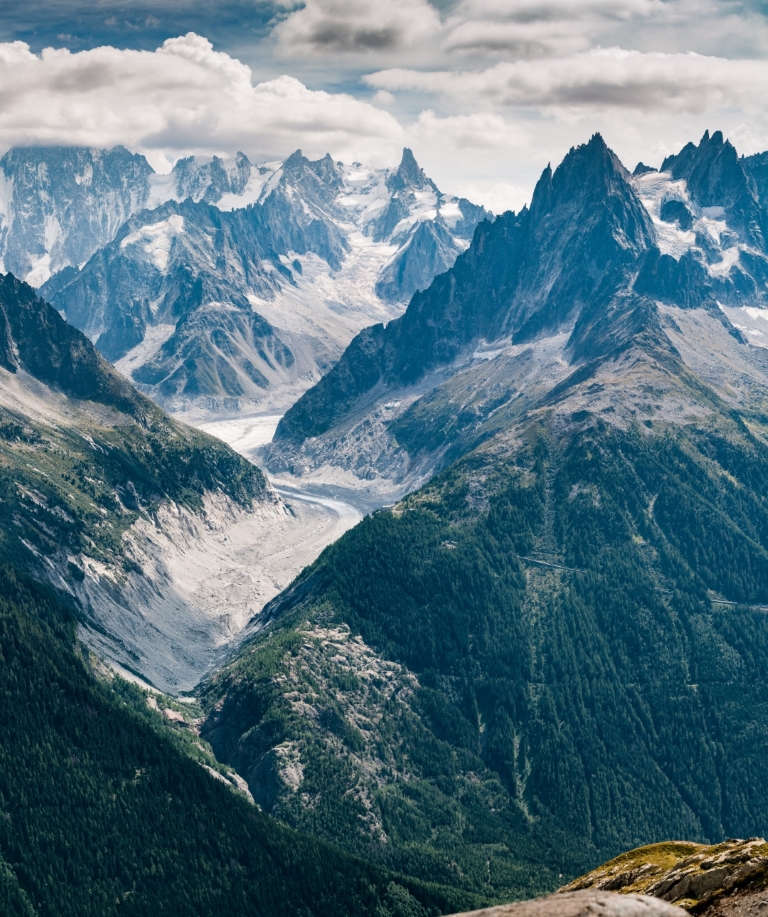
Valley glacier photo by Simon Fitall
There are 3 main parts to any system: inputs, processes and outputs.
Glaciers are dynamic. Glaciated landscapes may be seen as a system with many interrelated components (stores), processes (cause/effect mechanisms), inputs and outputs. This forms an open system.
- Inputs
- precipitation (snowfall)
- material from deposition, weathering and mass movement
- avalanches
- thermal energy (from the sun)
- kinetic energy
- Outputs (Ablation)
- evaporation
- sublimation
- wind erosion
- meltwater
- Stores
- ice
- water
- debris
- potential energy (from its location)
- Throughputs/processes
- debris movement downslope
- deposition
- kinetic energy from glacier movement
Glaciers themselves can be seen as systems as they have a TON of different inputs, outputs, flows (or transfers) and stores.
Useful key terms
- Terminus - the end of a glacier
- Snout - the end area of a glacier
- Ablation - melting
- Calving - when chunks of a glacier terminus fall into water
- Advance - when a glacier is moving forwards; gaining mass balance
- Recession - when a glacier is retreating; losing mass balance
- Area of accumulation - the area of a glacier where it is gaining mass
- Area of ablation/wastage - the area of a glacier where it loses mass
- Névé - young, granular snow
- Firn - névé which has survived a full season (year) of ablation and is partially compacted, and has been recrystallised into a substance denser than névé, an intermediate stage to becoming glacial ice.
- Firn line/equilibrium line - the zone on a glacier where accumulation is equal to ablation over a 1-year period
- Sintering - continued fusion and removal of air as a result of compression by the continued accumulation of snow and ice
- Aspect - the direction that a slope faces.
- Azimuth - the compass direction of an object
The Glacial Budget and Mass Balance
A glacier forms when snowfall exceeds summer melt in an area, resulting in the accumulation of snow and ice year after year, typically in a hollow on a mountain with a northwest-southeast aspect in the northern hemisphere.
Over time, snow is compacted and turned into glacial ice, and when this is around 40m thick, the intense pressure causes it to begin flowing. The top of the glacier is white, but glacial ice at the base of the glacier is blue as oxygen has left the system.
Snowflakes -> Granular snow -> Névé -> Firn -> Glacial ice
Glacial ice has a density of 850kg/m3. It is rock hard, feels glassy and is almost translucent.
The glacier mass balance is the total sum of all the accumulation (snow, ice, freezing rain) and melt or ice loss (from calving icebergs, melting, sublimation) across the entire glacier, or amount of ablation.
Over a year, the graph of mass balance in a northern hemisphere glacier may look like this in a typical scenario:
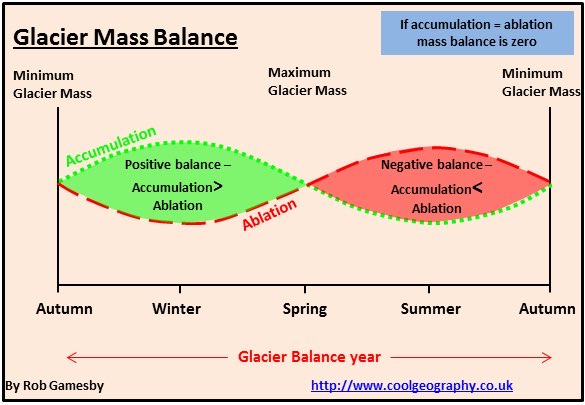
An equilibrium is reached between accumulation and amlation are equal. This point may be reached between the accumulation extreme in winter and the ablation extreme in the summer season. In the image above, as the accumulation is equal to ablation, the glacier is not growing.
Layers of snow within the ice give evidence of the way that it has formed.
ysical factors affecting landscapes
1.b. Glaciated landscapes are influenced by a range of physical factors.
Regional climate
The wind is a moving force and can carry out processes such as transportation, position and erosion. In the air, these are known as aeolian processes, and can contribute to shaping glaciated landscapes. It is more effective when acting upon fine materials, usually those previously deposited by ice or meltwater, such as smaller rocks, dirt and sand.
Temperature within the climate is another factor, as temperatures above 0°C will melt accumulated snow and ice, resulting in more outputs in the system. At highTypes of glacier and movement
(Date studied: ~29/09/2022)
An ice sheet is a mass of snow and ice, greater than 50,000km2 with considerable thickness.
A piedmont glacier spreads out as a wide lobe as it enters altitudes, there are typically more prolonged periods of above-freezing temperatures, and melting, compared to in high latitude locations, where is below freezing most of the time, allowing for glaciers to thicken and expansive ice sheets to form. Precipitation is another climate factor, with its totals and patterns, both region wider plain typically from a smaller valley
A valley glacier is one **bound by valley and seasonally, in determining the mass balance of a glacier system, as it provides the main inputs to these glaciers as snowfall.
er aally rate s aLatitude and Altitude
Beyond the Arctic and Antarctic circles, located at 66.5° north and south, the climate is very dry, with little seasonal variation. Being so dry and extremely cold, they are much different to more dynamic valley glaciers as they have higher precipitation levels, and more névé turns into firn. The dryness contributes to periglacial environments (see below for more about those!) while also turning the types of glaciers in these areas to more cold-based. This means that they flow much less quickly, and different types of movement occur.
Altitude also has a direct impact on the temperatures and development of valley glaciers. As temperatures typically decrease by 0.7oC every 100m of altitude gained, there are more likely to be valley glaciers in areas of high relief, as seen in the Alps and the Himalayas. These glaciers are still not as cold as cold-based glaciers, however.
Geology
Geology is more than just “weak” and “strong” rocks and resistance. It is a combination of properties that uniquely determine how rocks react to stress, mechanical and chemical forces, and the environnment.
Lithology is the chemical composition and physical properties of rocks. Some types, like basalt, are very resistant to erosion and weathering, as they are comprised of densely packed interlocking crystals. Clay, on the other hand, is weak and does not have these strong bonds on the molecular level. The solubility of rocks like chalk can also be affected by acidity, making them prone to chemical weathering, as seen through carbonation. Weakly-bonded rocks also reduce their resistance to glacial erosion.
Structure relates to the physical rock types, like faulting, bedding and jointing. These all have an impact on how permeable rocks are. Chalk, for example, is very porous, spaces between the particles within it on the molecular level allow water to percolate through. In glaciated environments, this is significant as freeze-thaw action can crack rocks with faults or pores from the inside. This compares to crystalline rocks such as igneous granite which do not have any of these structural weaknesses.
Some types of limestone, like carboniferous limestone, have many interconnected joints, giving it ‘secondary permeability’.
Primary permeability is when spaces (pores) absorb and retain water.
Relief and aspect
These have an impact on the the microclimate. This is a small region with its own distinct climatic chawalls**, coming from a higher mountain region, from a plateau on an ice cap or an ice sheet.
An ice cap is a dome-shaped mass of glacial ice usually situated on a highland area and also covers >50,000km2.
Valley glaciers usually occur in high altitude locations, with high relief, have fast rates of flow at 20–200m/year (mostly warm-based) and have distinct areas of ablation and accumulation, descending from mountains.
Ice sheets, however, are large masses of snow and ice defined by being greater than 50,000 km² and are usually in locations of high/low latitude and have slow racteristics, for example, one side of a mountain, or the north side of a valley. Generally, wider climate characteristics play a larger role in influencing the behaviour of glaciers, but glaciers are also affected by various lower-level and smaller-scale conditions.
Areas of high relief mean there is greater gravitational potential energy for faster glacial movement.
Types of glacier and movement
1.c. There are different types of glacier and glacier movement.
An **ice sheet is a mass o so ice reater ha , it nsderae thine imnt acr spres out s a ie loe s it eter aider a typically frm a maller le all glacier is one ond b ally all, ming frm a ihe mnin egir a lateauon an ice ca or an ie sheetn ie cs of movement and only around 5m/year (mostly cold-based). The base of the glacier is frozen to the bedrock and has a little precipitation but also lower temperatures so adomeshaped ms of glacial ie usaly sitated n a hhland re nd also coers mblation levels are lower too.
Fundamentally, glaciers move because of gravity. The gradient influences the effect of gravity on glaciers. The thickness of the ice and the pressure exerted on the bedrock can also influence melting and movement. More accumulation also leads to more movement. When ice is solid and rigid, it breaks into crevasses (big cracks in icegaps visible from the surface). Under pressure, ice will deform and behave like plastic (zone of Plastic Flow on the lower half of the glacier) making it move faster. Conversely, the rigid zone is on the top half of the glacier.
Valley glaciers usally or altitude ain, th high relief, hae as rates o lo at ear mostly warmae and hve istict ares of blation and accumulation, descending from mountains.
Ice sheets, however, are large msss f snow and ice ine in grate than km n are say inoctins o il latite and have slow rates o moement and ly aroun ear ostl coldased. he ase of te glacie s froen he edroc and has a ittle pecipitation bu also oer temperates so alaton l are loer .
Cold-based (polar) glaciers:
- have a slow rate of movement (<5m/year);
- are located in extreme latitude (polar) regions;
- are generally flat;
- have a low basal temperature, remaining stuck to the bedrock below the pressure melting point;
- are formed in low precipitation areas, and the glacier remains below freezing point during all seasons.
Warm-based (alpine) glaciers:
- have rapid movement (20-200m/year);
- are located in high-altitude (mountainous) regions;
- have a basal temperature at or above the pressure melting point;
- are in areas of steep(er) relief;
- have water present throughout, with the ice acting as a lubricant.
Cold-based glaciers are unable to move by basal sliding as the basal temperature is below the pressure melting point. Instead, they move through internal deformation.
Ice at 0°C deforms 100 times faster than at -20°C. Thus, the movement within cold-based glaciers is limited by there being a lack of lubricant, and the cold temperatures inhibiting internal deformation to a very slow rate.
Factors affecting the microclimate
The microclimate is a small region with its own distinct climatic characteristics, for example, one side of a mountain, or the north side of a valley. Generally, wider climate characteristics play a larger role in influencing the behaviour of glaciers, but glaciers are also affected by various lower-level and smaller-scale conditions.
Regional climate
The wind is a moving force and can carry out processes such as transportation, position and erosion. In the air, these are known as aeolian processes, and can contribute to shaping glaciated landscapes. It is more effective when acting upon fine materials, usually those previously deposited by ice or meltwater, such as smaller rocks, dirt and sand.
Temperature within the climate is another factor, as temperatures above 0°C will melt accumulated snow and ice, resulting in more outputs in the system. At higher altitudes, there are typically more prolonged periods of above-freezing temperatures, and melting, compared to in high latitude locations, where is below freezing most of the time, allowing for glaciers to thicken and expansive ice sheets to form. Precipitation is another climate factor, with its totals and patterns, both regionally and seasonally, in determining the mass balance of a glacier system, as it provides the main inputs to these glaciers as snowfall.
Geology
Lithology is the chemical composition and physical properties of rocks. Some types, like basalt, are very resistant to erosion and weathering, as they are comprised of densely packed interlocking crystals. Clay, on the other hand, is weak and does not have these strong bonds on the molecular level. The solubility of rocks like chalk can also be affected by acidity, making them prone to chemical weathering as seen, through carbonation.
Structure relates to the physical rock types, like faulting, bedding and jointing. These all have an impact on how permeable rocks are. Chalk, for example, is very porous, spaces between the particles within it on the molecular level allow water to percolate through. Some types of limestone, like carboniferous limestone, have many interconnected joints, giving it ‘secondary permeability’.
Primary permeability is when spaces (pores) absorb and retain water.
Latitude and Altitude
Beyond the Arctic and Antarctic circles, located at 66.5° north and south, the climate is very dry, with little seasonal variation. Being so dry and extremely cold, they are much different to more dynamic valley glaciers as they have higher precipitation levels, and more névé turns into firn. The dryness contributes to periglacial environments (see below for more about those!) while also turning the types of glaciers in these areas to more cold-based. This means that they flow much less quickly, and different types of movement occur.
Altitude also has a direct impact on the temperatures and development of valley glaciers. As temperatures typically decrease by 0.7oC every 100m of altitude gained, there are more likely to be valley glaciers in areas of high relief, as seen in the Alps and the Himalayas. These glaciers are still not as cold as cold-based glaciers, however.
How are lacial landscapes developed?
Glacial landforms are typically classified according to erosional and depositional processes. This development can be described as a series of interrelated processes.
Glacial erosional landforms
Corries
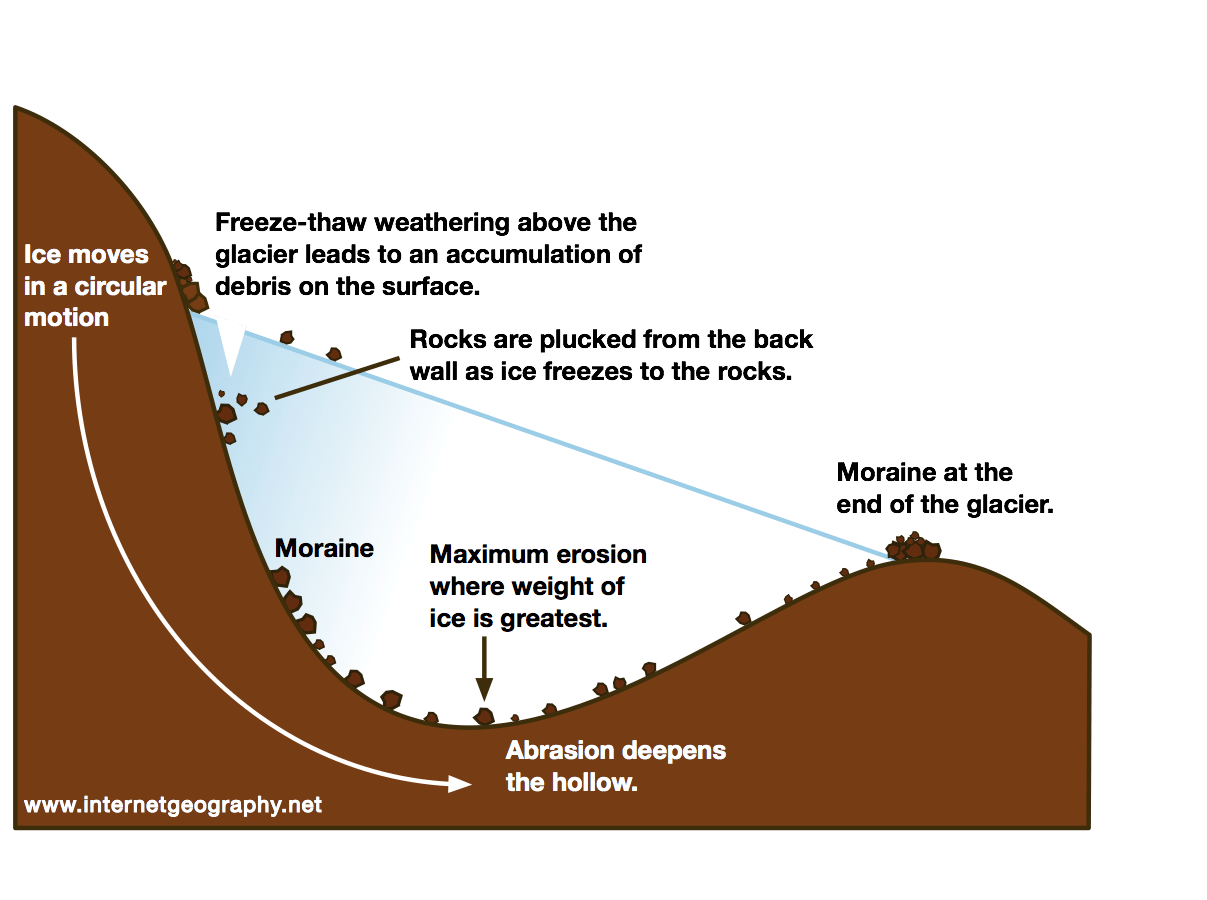
The processes occurring in a corrie.
A corrie is an armchair-shaped depression in a mountain. Also known as a cwm or cirque, they are formed from small hollows on the slopes of mountains where snow begins to accumulate, typically on the north-west to south-east facing slopes (or with an azimuth ranging from 300-140 degrees) on a mountain in the northern hemisphere.
This is due to its aspect, or the orientation of which a slope faces, with this specific aspect resulting in having less insolation. Greater amounts of irradiation add thermal energy to the system, resulting in ablation.
This virgin snow is known as névé, which becomes firn after one complete cycle without melting (i.e. surviving a summer ablation period; of 1 year).
This newly-formed hollow, deepened by nivation (e.g. freeze-thaw processes) from te ice, then begins to move because of gravity acting upon the ice mass. The ice freezes to the back wall, plucking material (debris), which is then washed out through a process known as rotational slipping. Over multiple years, the snow at the bottom is compressed into ice, and the material plucked or that has fallen into the bergschrund crevasse is used by the ice to abrade and further deepen the hollow. Comparatively, the ice at the front of the corrie may be much thinner and therefore has lower pressure and is less abrasive, creating a rock lip, supplemented by washed out moraine from previously plucked material.
When this ice melts or the area is deglaciated, a tarn (or corrie lake) is created, enclosed by the rock lip. Material may then continue to fall down from the back wall due to continued weathering, combined with aspect and steep relief, known as scree.
Arêtes
An arête is a knife-shaped, narrow ridge formed when two corries’ back walls continually erode back-to-back. Over time, these back walls meet, and a distinct ridge is formed.
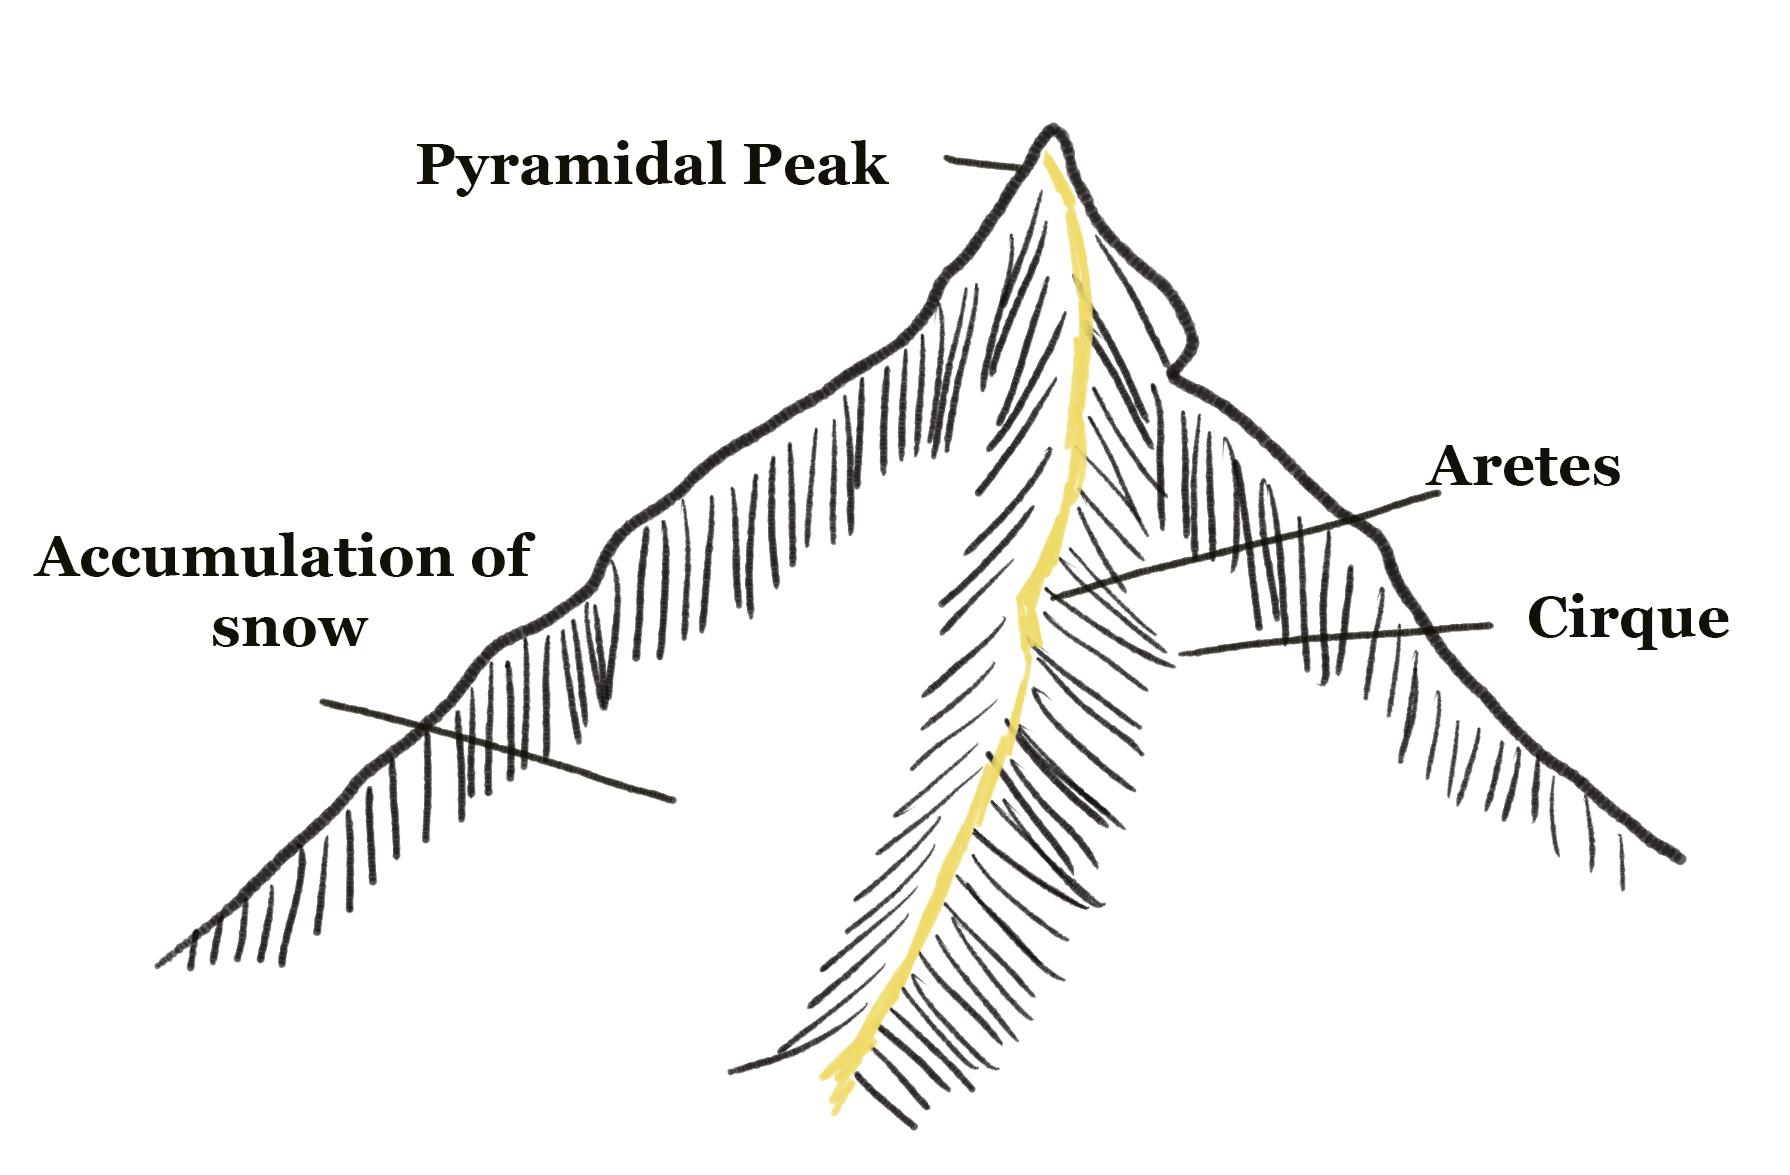
A diagram of a mountain, which has had erosional processes acting upon it.
Pyramidal peaks
A pyramidal peak is a high mountain whose surroundings have been eroded as corries. Three or more corries eroding back-to-back (similarly to how arêtes form) result in this sharp peak forming. There are typically distinct aretes visible all the way up to the peak, representing the boundary between corries.
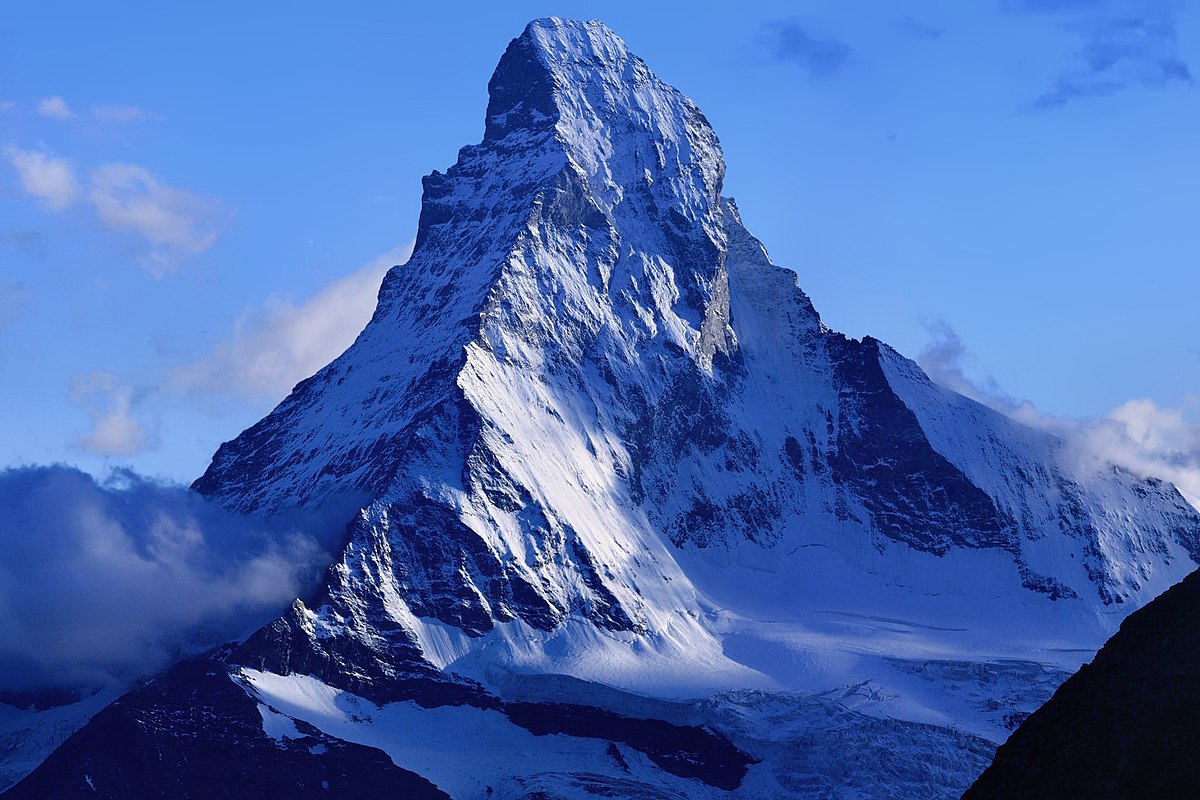
The Matterhorn in the European Alps. It is a great example of a pyramidal peak.
U-shaped valleys
Also known as a glacial trough, a U-shaped valley is formed as a result of strongly channelled ice, bulldozing its way through a valley. On the valley’s sides, plucking occurs, causine sides to steepen. This rocky material is then dragged by the glacier helping it to carve out more of the landscape.
The actual shape of most U-shaped valleys is parabolic.
Firstly, before a glacial period, a V-shaped valley exists, having moderately steep sides and a central river channel, with interlocking spurs being a distinct feature. During periods of glaciation, snow begins to accumulate in these valleys as they are often sheltered.
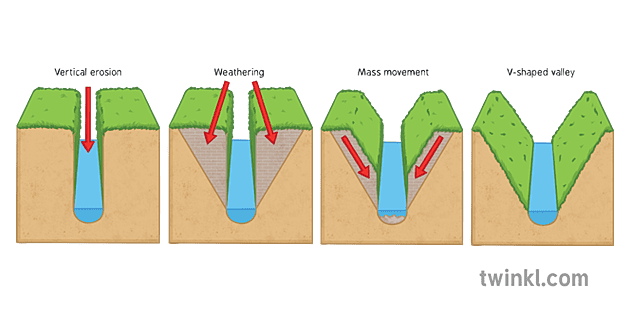
How a V-shaped valley is formed. Remember this from GCSE? (if not, recap yourself on the GCSE cheat sheet!
When an ice mass has formed in the valley or flowed from an upland area, freeze-thaw weathering begins to occur above the glacier line (where this ice mass is), causing the valley to steepen, in the same way as a corrie steepens its back wall. The glacier itself also causes plucking, mostly on the sides, as rocks are frozen and ripped as the glacier moves. Vertical abrasion also deepens the valley floor as subglacial material comes into contact with the bedrock.
Hanging valley
Hanging valleys with waterfalls and truncated spurs are a feature of the U-shaped alley landform. They are visible within this glacial trough, and form as a smaller glacier from another valley has created a U-shaped valley which then enters the larger valley. As the hanging alley’s lacier is smaller, it is less powerful, so it does not reach the base of the larger glacial trough valley.
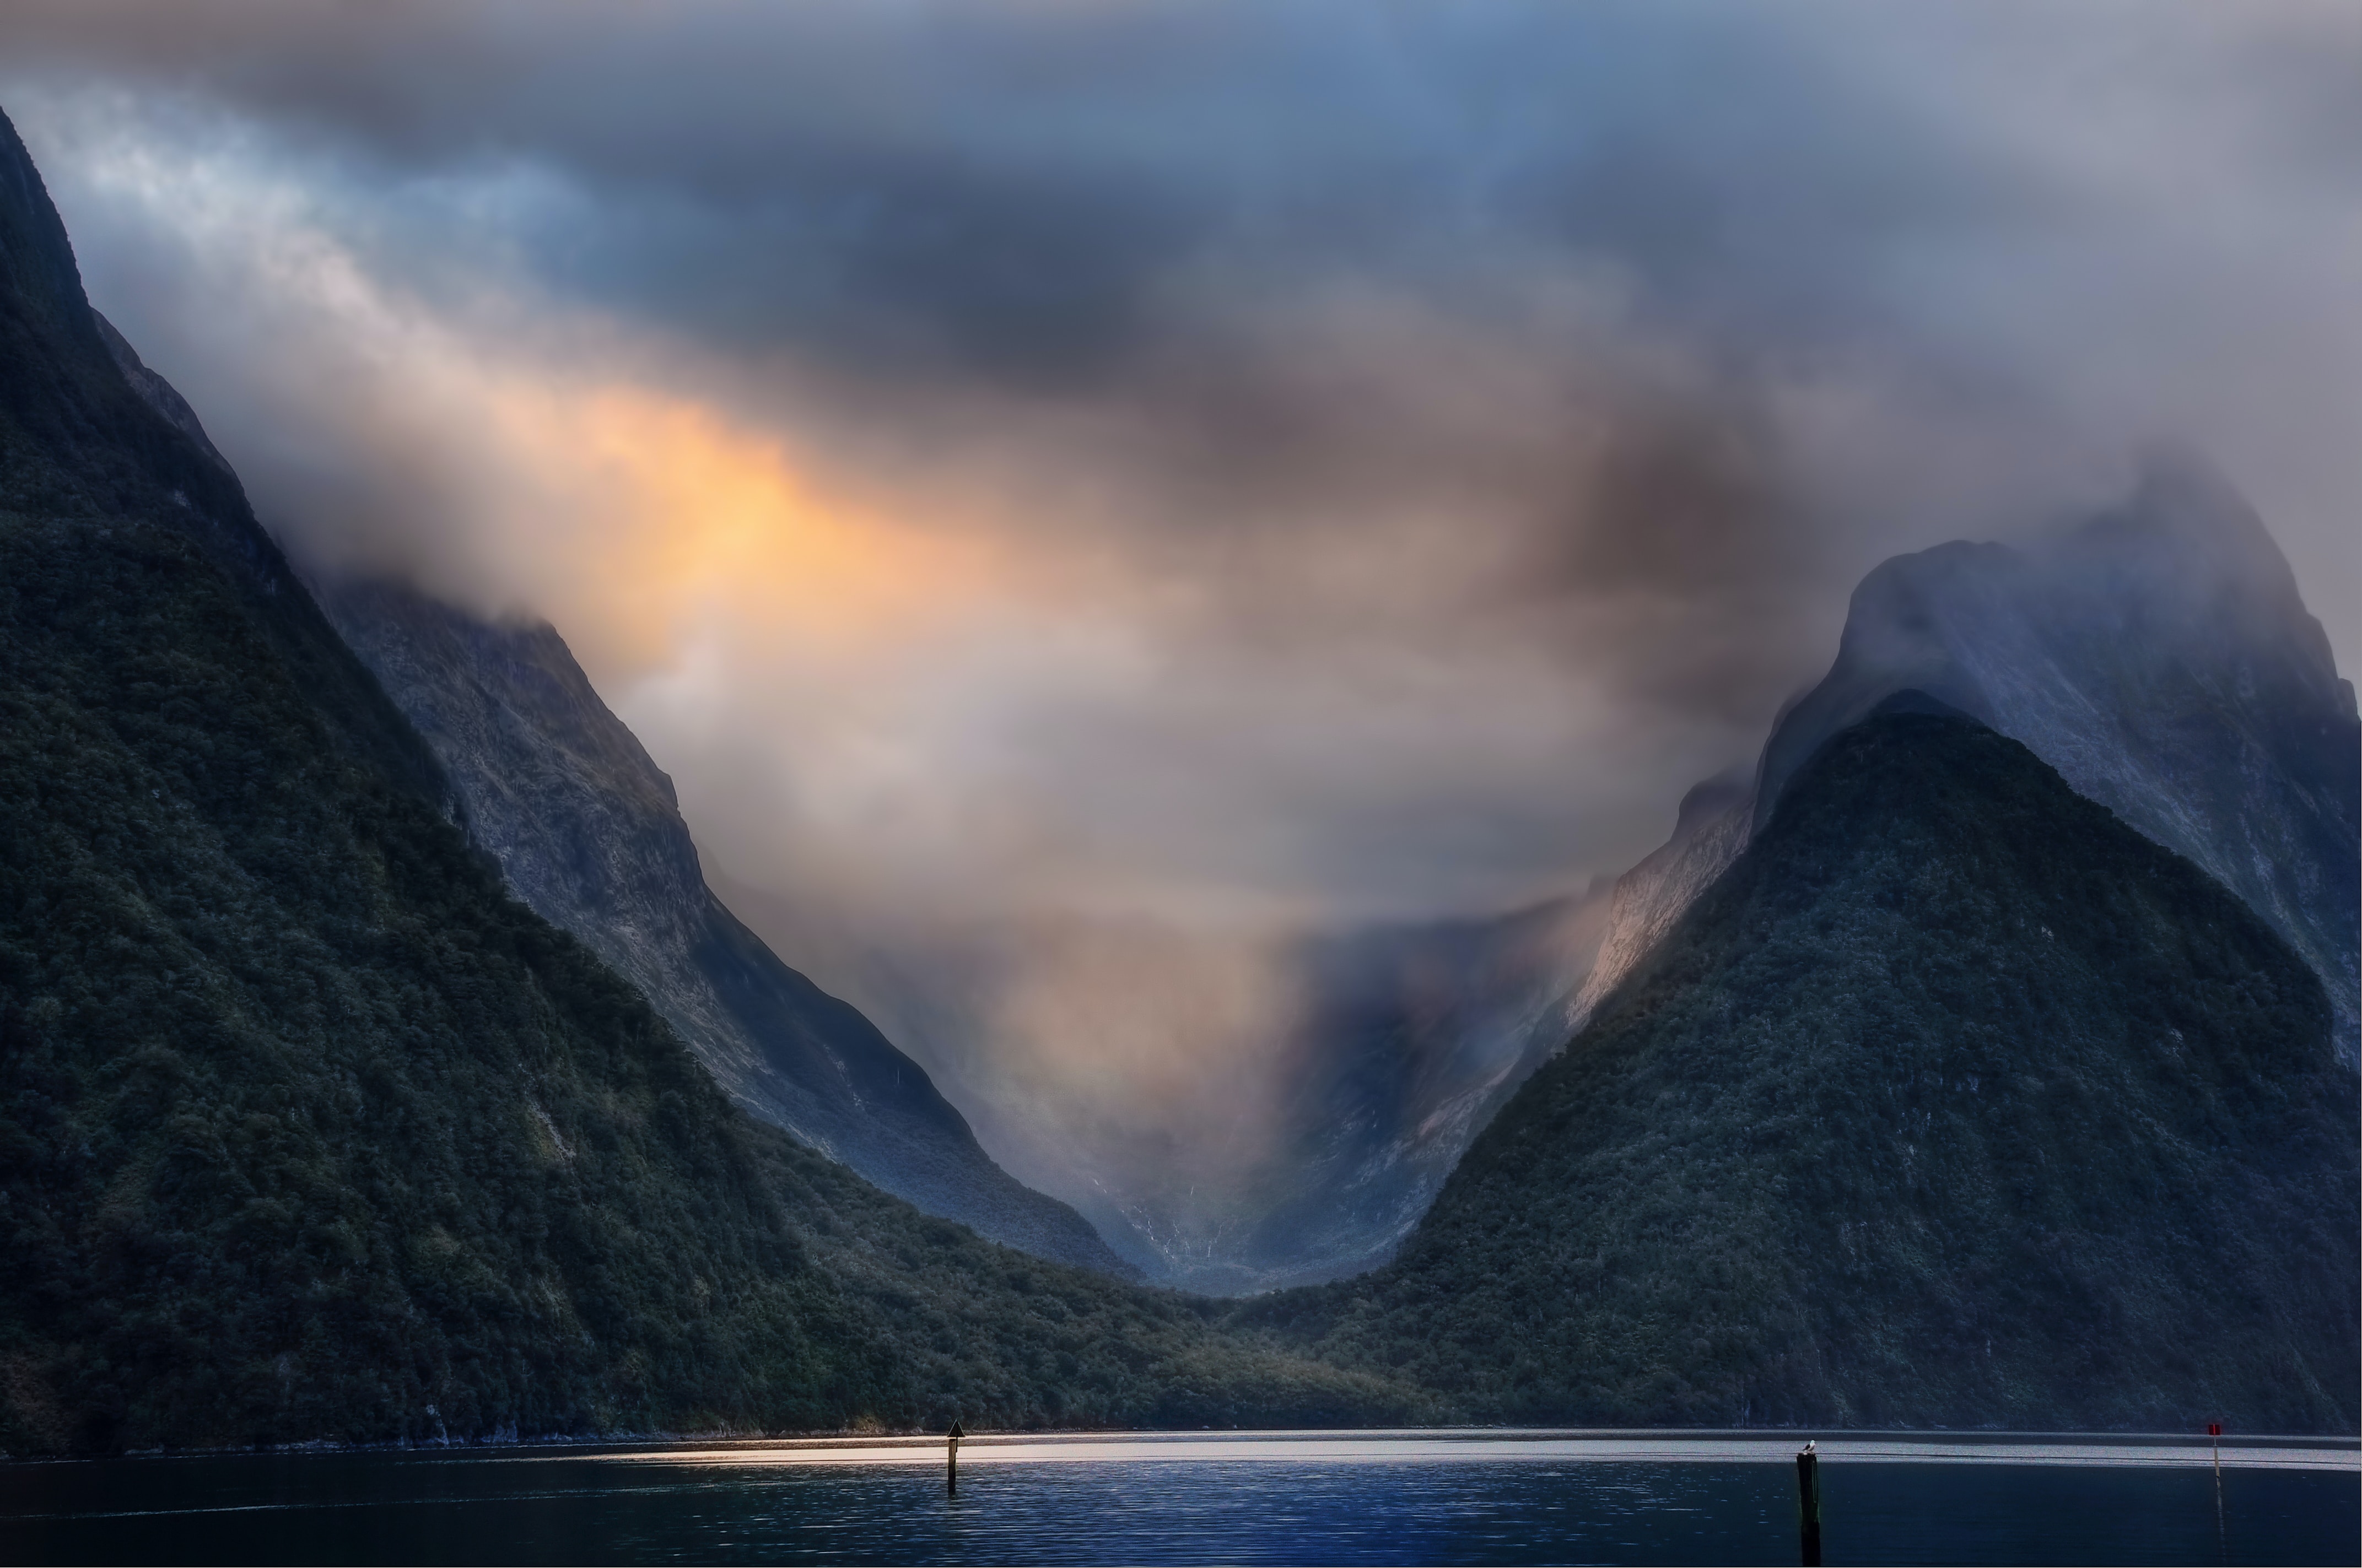
Photo from Peter Hammer.
Water features
After deglaciation, there may be some (iconic) water features in these glacial troughs.
Ribbon lake
Glaciers ero the valley into the typical U-shape. These lakes are typically long, thin and deep as a result of compressing flow, as this ice is likely to havee from an area of high incline to a more expansive area a the ice is more likely to move faster and pushed into a thinner area downstream, so is more likely to erode vertically rather than laterally. This depression (or rock basin) is then refilled with water after a glacier retreats. More detail over aieted to swatullswattecacvt t td he Li District case study section.
Misfit stream
A ribbon lake well as a misfit stream may also be present in the base of the newly-formed glacial trough valley after deglaciation.
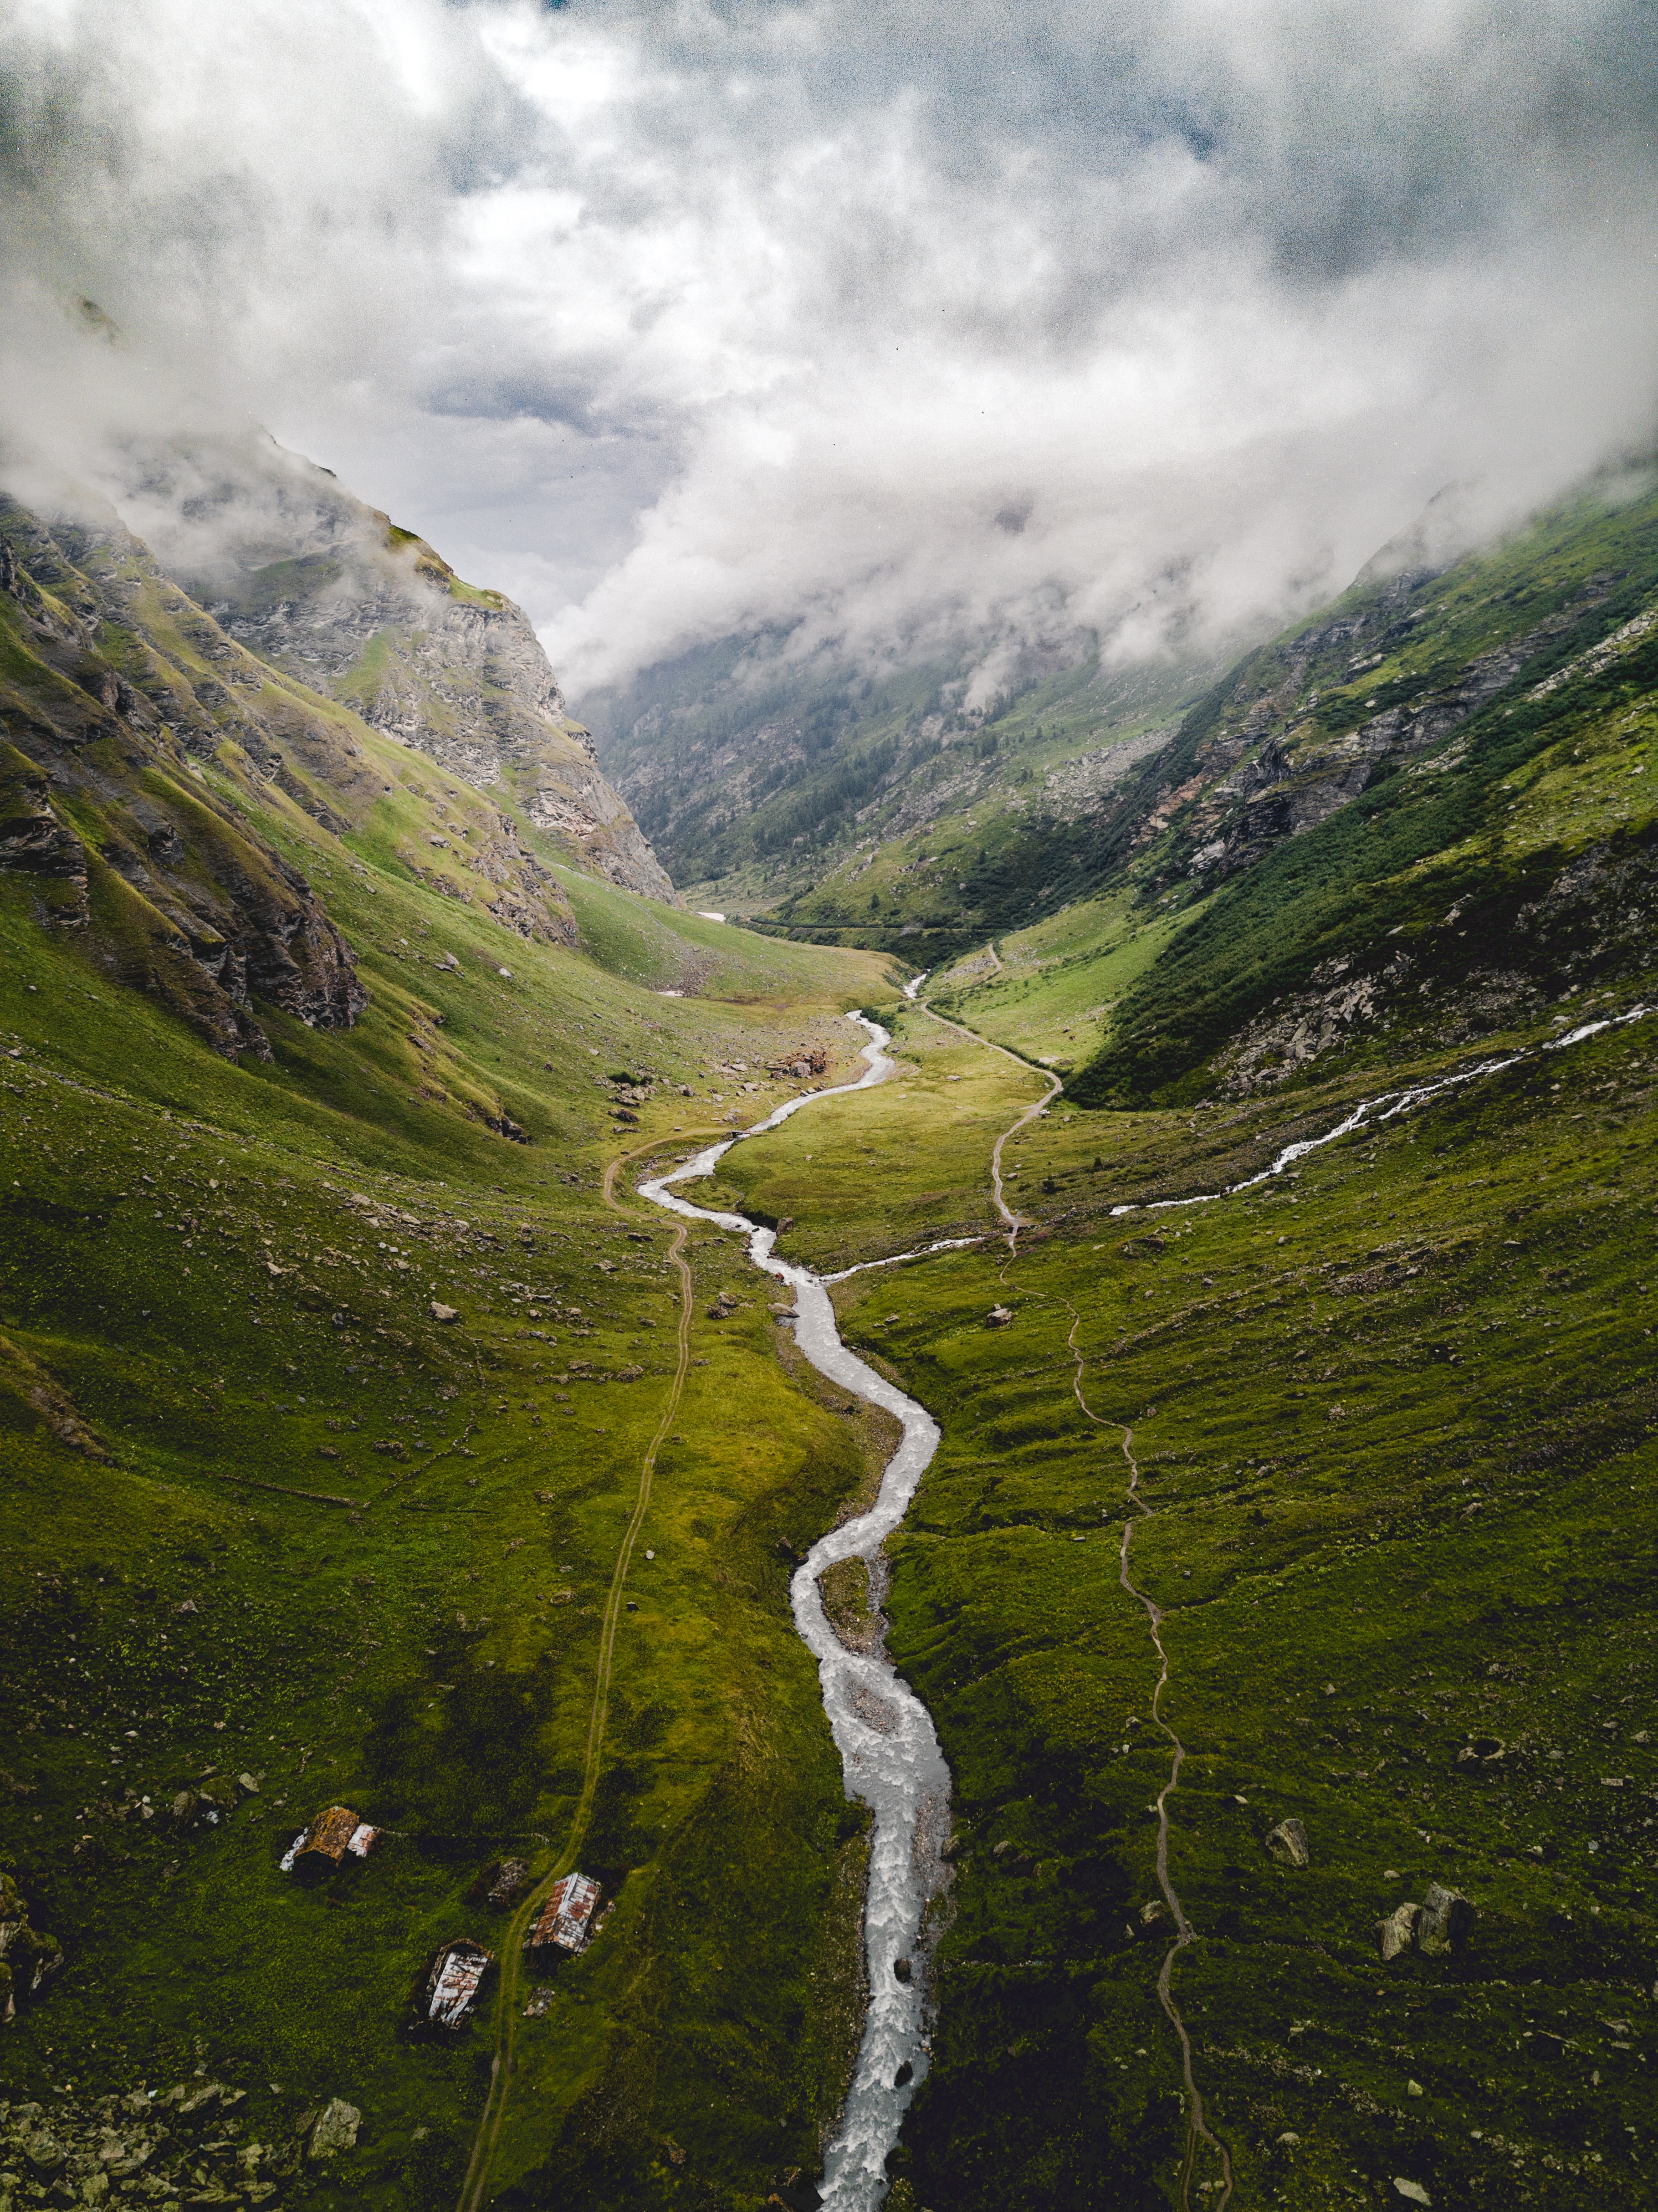
Misfit stream: Photo from Mario Álvarez.
Roche moutonnées
A roche moutonnée is a more rebstant rock in the path of a glacier. Light abrasion from the above subglacial material occurs on the upvalley (stoss) side, resulting in striations, grooves, and polishing from subglacial debris. There may also be pressure melting at a local scale on this side.
As this meltwater is forced up and oer the roche moutonnée, mechanical plucking and freeze-thaw weathering occur. On the down-valley (lee) side, the pressure release results in refreezing into ice, while the glacier continues to move, thereby pulling away the rock and giving it a craggy appearance.
Roche moutonnées are generally concentrated in areas of competent bedrock, such as granitoids (Glasser, 2002) - this essentially means that rocks are somewhat resistant to deformaton.
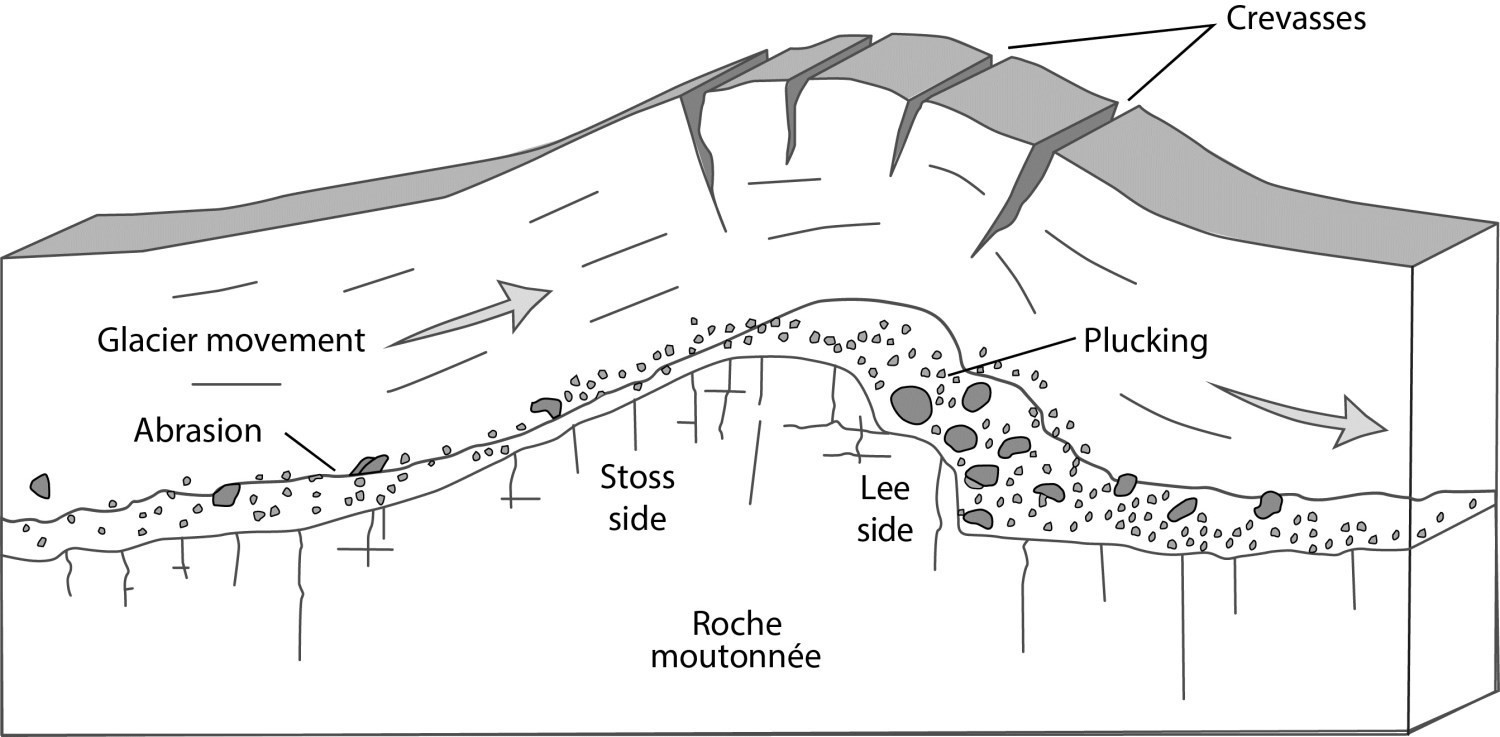
Source: Québec government website
The word is French with “roche” meaning rock and “moutonée” meaning sheep.
More specifically, it was introduced by a French geologist called Horace-Bénédict de Saussure (1740-1799). The word is called like so due to its resemblance to the shape of a wig, worn by 18th-century French aristocrats which shaped their hair like a wave. Sheep fat was used to hold the wig in place, which explains the term moutonné (Benn and Evans, 2010). In Sweden, very large roches moutonnées are called flyggbergs, with some being up to 3 km long and 350 m wide (Rudberg, 1954; 1973; Iverson et al., 1995; Benn and Evans, 2010).
Ellipsoidal basins
These are no ordinary valley or alpine glacier erosional landform. These are huge areas formed by ice sheets such as the Laurentide Ice Sheet in North America. (more detail with the Minnesota Ice Sheet Case Study)
These huge ice sheets (more than 50,000km2) exert large amounts of pressure on the landscape as well as great erosional quarrying by subglacial material. Examples of this feature include Hudson Bay, and smaller ellipsoidal basins created the Great Lakes in North America.
On top of the subglacial erosion which may have occurred, some of this large-scale erosional landscape’s formation is also due to isostatic lowering. This involves the sheer mass of the ice sheet, potentially several kilometres thick, exerting pressure on the lithosphere and effectively compressing it into being smaller.
After deglaciation, isostatic readjustment may occur, and these compressed, lowered areas may readjust and bounce back upwards, now being under no additional pressure.
Glacial depositional landforms
- Supraglacial material is material which is located on the top of a glacier.
- Englacial material is material which is located inside a glacier.
- Subglacial material is material which is located on the base of a glacier.
- Material deposited during glaciation is called drift.
- Material deposited directly by ice is called till.
- Material deposited by meltwater is called outwash, or glacio-fluvial material.
Lodgement till is material deposited by advancing ice, due to pressure being exerted into existing valley material, and left behind as ice advances, such as the theory of dsepositional drumlins.
Ablation till is material deposited at the terminus by melting ice from stagnant, or retreating glaciers during a warm period or end of glaciation event. Most depositional landforms are this type.
It can be known whether sediment was deposited by water or ice. Ice-transported sediment is angular, not curved, as it has not been subject to more abrasive, erosional forces by the meltwater. The order of size of sediments can indicate this too, as water deposits sediment progressively due to reducing energy levels, while glaciers deposit material unsorted; ‘en masse’. Glaciers also deposit till in mounds and ridges, as, during ablation, this englacial and supraglacial material gets dropped on the bedrock below. This is distinct from the layered deposition (or strata) typically characterised by fluvial processes. Glaciofluvial processes involve an amount of stratification but not complete sorting.
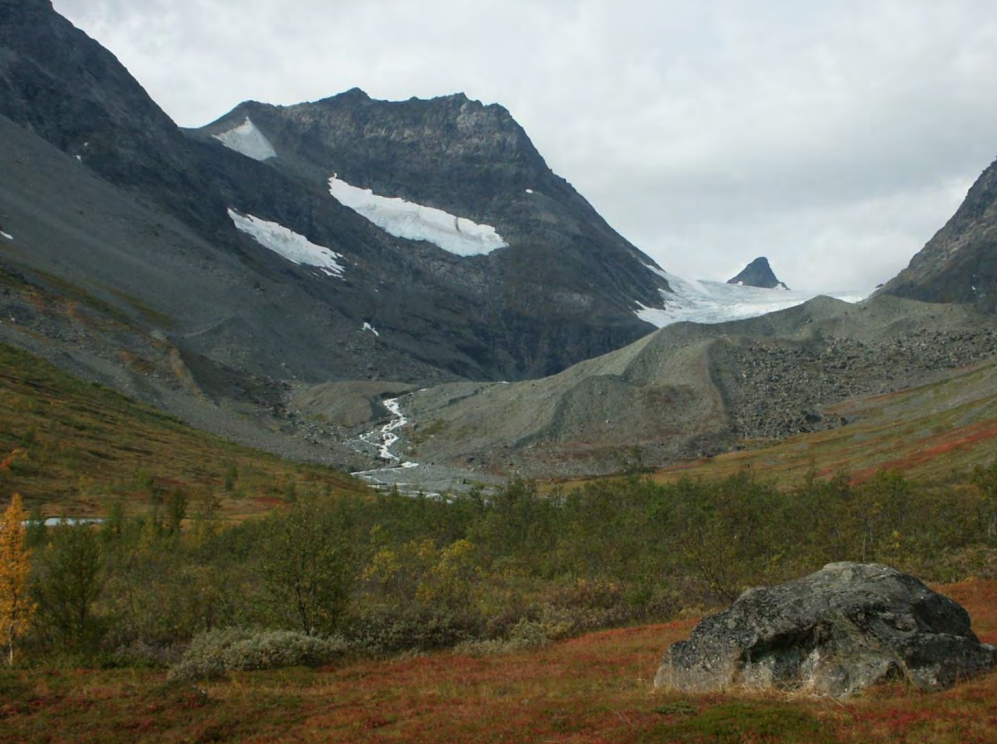
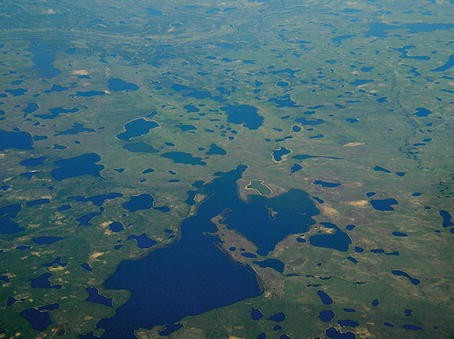
There are a range of depositional landforms visible in this photograph. Can you identify them all?
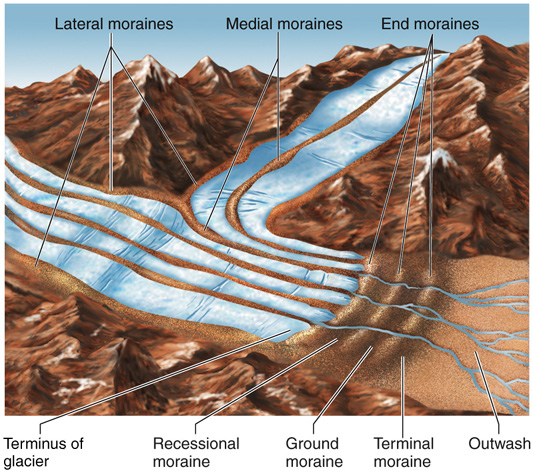
A great diagram of all the different types of moraine.
Moraines
Moraines are ridges of soil, rocks and till which have been deposited by a glacial system. They are added to the glacial system over time through weathering, rockfalls, freeze-thaw action, etc.
Strictly speaking, only the main three are on the OCR specification, but there’s no harm in being able to explain them all.
Medial moraines
Form in the centre of a glacial channel (typically when two glaciers merge - see the image above an o ad you can see how the mountain in the middle is being carved out). Also may occur when their lateral moraines meet and combine into one.
Lateral moraines
Ridges which form on the sides (margins) of a glacial channel, and are the result of the accumulation of debris due to erosional processes on valley sides such as freeze-thaw.
End moraines
These mark a pause or halt of glacial retreat (e.g. when there are a couple of decades with little advance or retreat). These pauses typically are not very long so deposits reflect this, not being too large either (100m max)
Terminal moraine
A ridge, often characterised by bein g the largest and most prominent in the area, marking the maximum advance of a glacial period (glacial maximum), deposited at the snout of the glacier. Often crescent-shaped when observed from the cross profile.
Recessional moraines
A combination of the end and terminal moraines.
Erratics
They are randomly placed bits of rock and other debris which can be characterised by being of different geology compared to that of surrounding rocks, e.g. limestone in a valley mainly of basalt.
This can be seen in the Lake District where rocks belonging to the rock group Borrowdale Volcanics were found in an area dominated by limestone.
The Bowder Stone is another example being a 2,000-ton andesite lava boulder south of Keswick in the Lake District which most likely originated in Scotland.
Drumlins
Drumlins are unsorted mounds of streamlined till, commonly elongated parallel to the former direction of ice flow, composed of glacial debris.
It is not known exactly how drumlins are formed, but the most likely and agreed upon explanation for their formation is that the glacier becomes overloaded with till (loses competence), so begins to deposit this sediment due to the increased friction that the till brings (‘smearing’ the landscape). This sediment accumulates and quickly compounds, and other till that flows over the initial bump can become stuck, growing this mound of unsorted till. Over time, this grows, and when the glacier retreats, the distinct hill is revealed. This video is a good example of the theory of depositional drumlin formation.
This is an example of lodgement till (not ablation till) as it is formed as the glacier is still advancing.
Others argue that they may have a bedrock core (hence rock-cored drumlins) and as material was obstructed, sediment began accumulating around this, much like in the way of a dune, and was streamlined in the same way as above.
Another argument to the formation of drumlins is that they occur when a glacier move over an area of existing glacial deposits. As the glacier moves over this existing till, the pressure of the overlying ice causes the till to be remoulded and changed into the characteristic shape of streamlined till that we know and love as a drumlin.
They typically occur in larger groups, or ‘swarms’. This is known as a ‘‘basket of eggs’ topography.
Drumlins can be up to 1,000m in length but are typically around 300-500m. They also improve revenue for farmers, as the topography allows them to have a larger farming area in the same sized plot of land. Their length-to-width ratio is typically between 1.8 and 4.1, and this may be an indication of past glacial velocities, with longer drumlins indicating a faster ice velocity due to the laminar flow of ice.
Drumlins are often found in conjunction with morainic landforms and other depositional features like eskers, kames and outwash plains.
Did you know that the ground between two drumlins is known as a dungeon?
Case study: Lake District
The Lake District is a mountainous area in the north of England. Over the Pleistocene epoch, many glacials and interglacials moulded the area into what it is today, with the most recent activity during the Last Glacial Period (the Loch Lomond Stadial; 12kya) being responsible for the current appearance of the valley landscape.
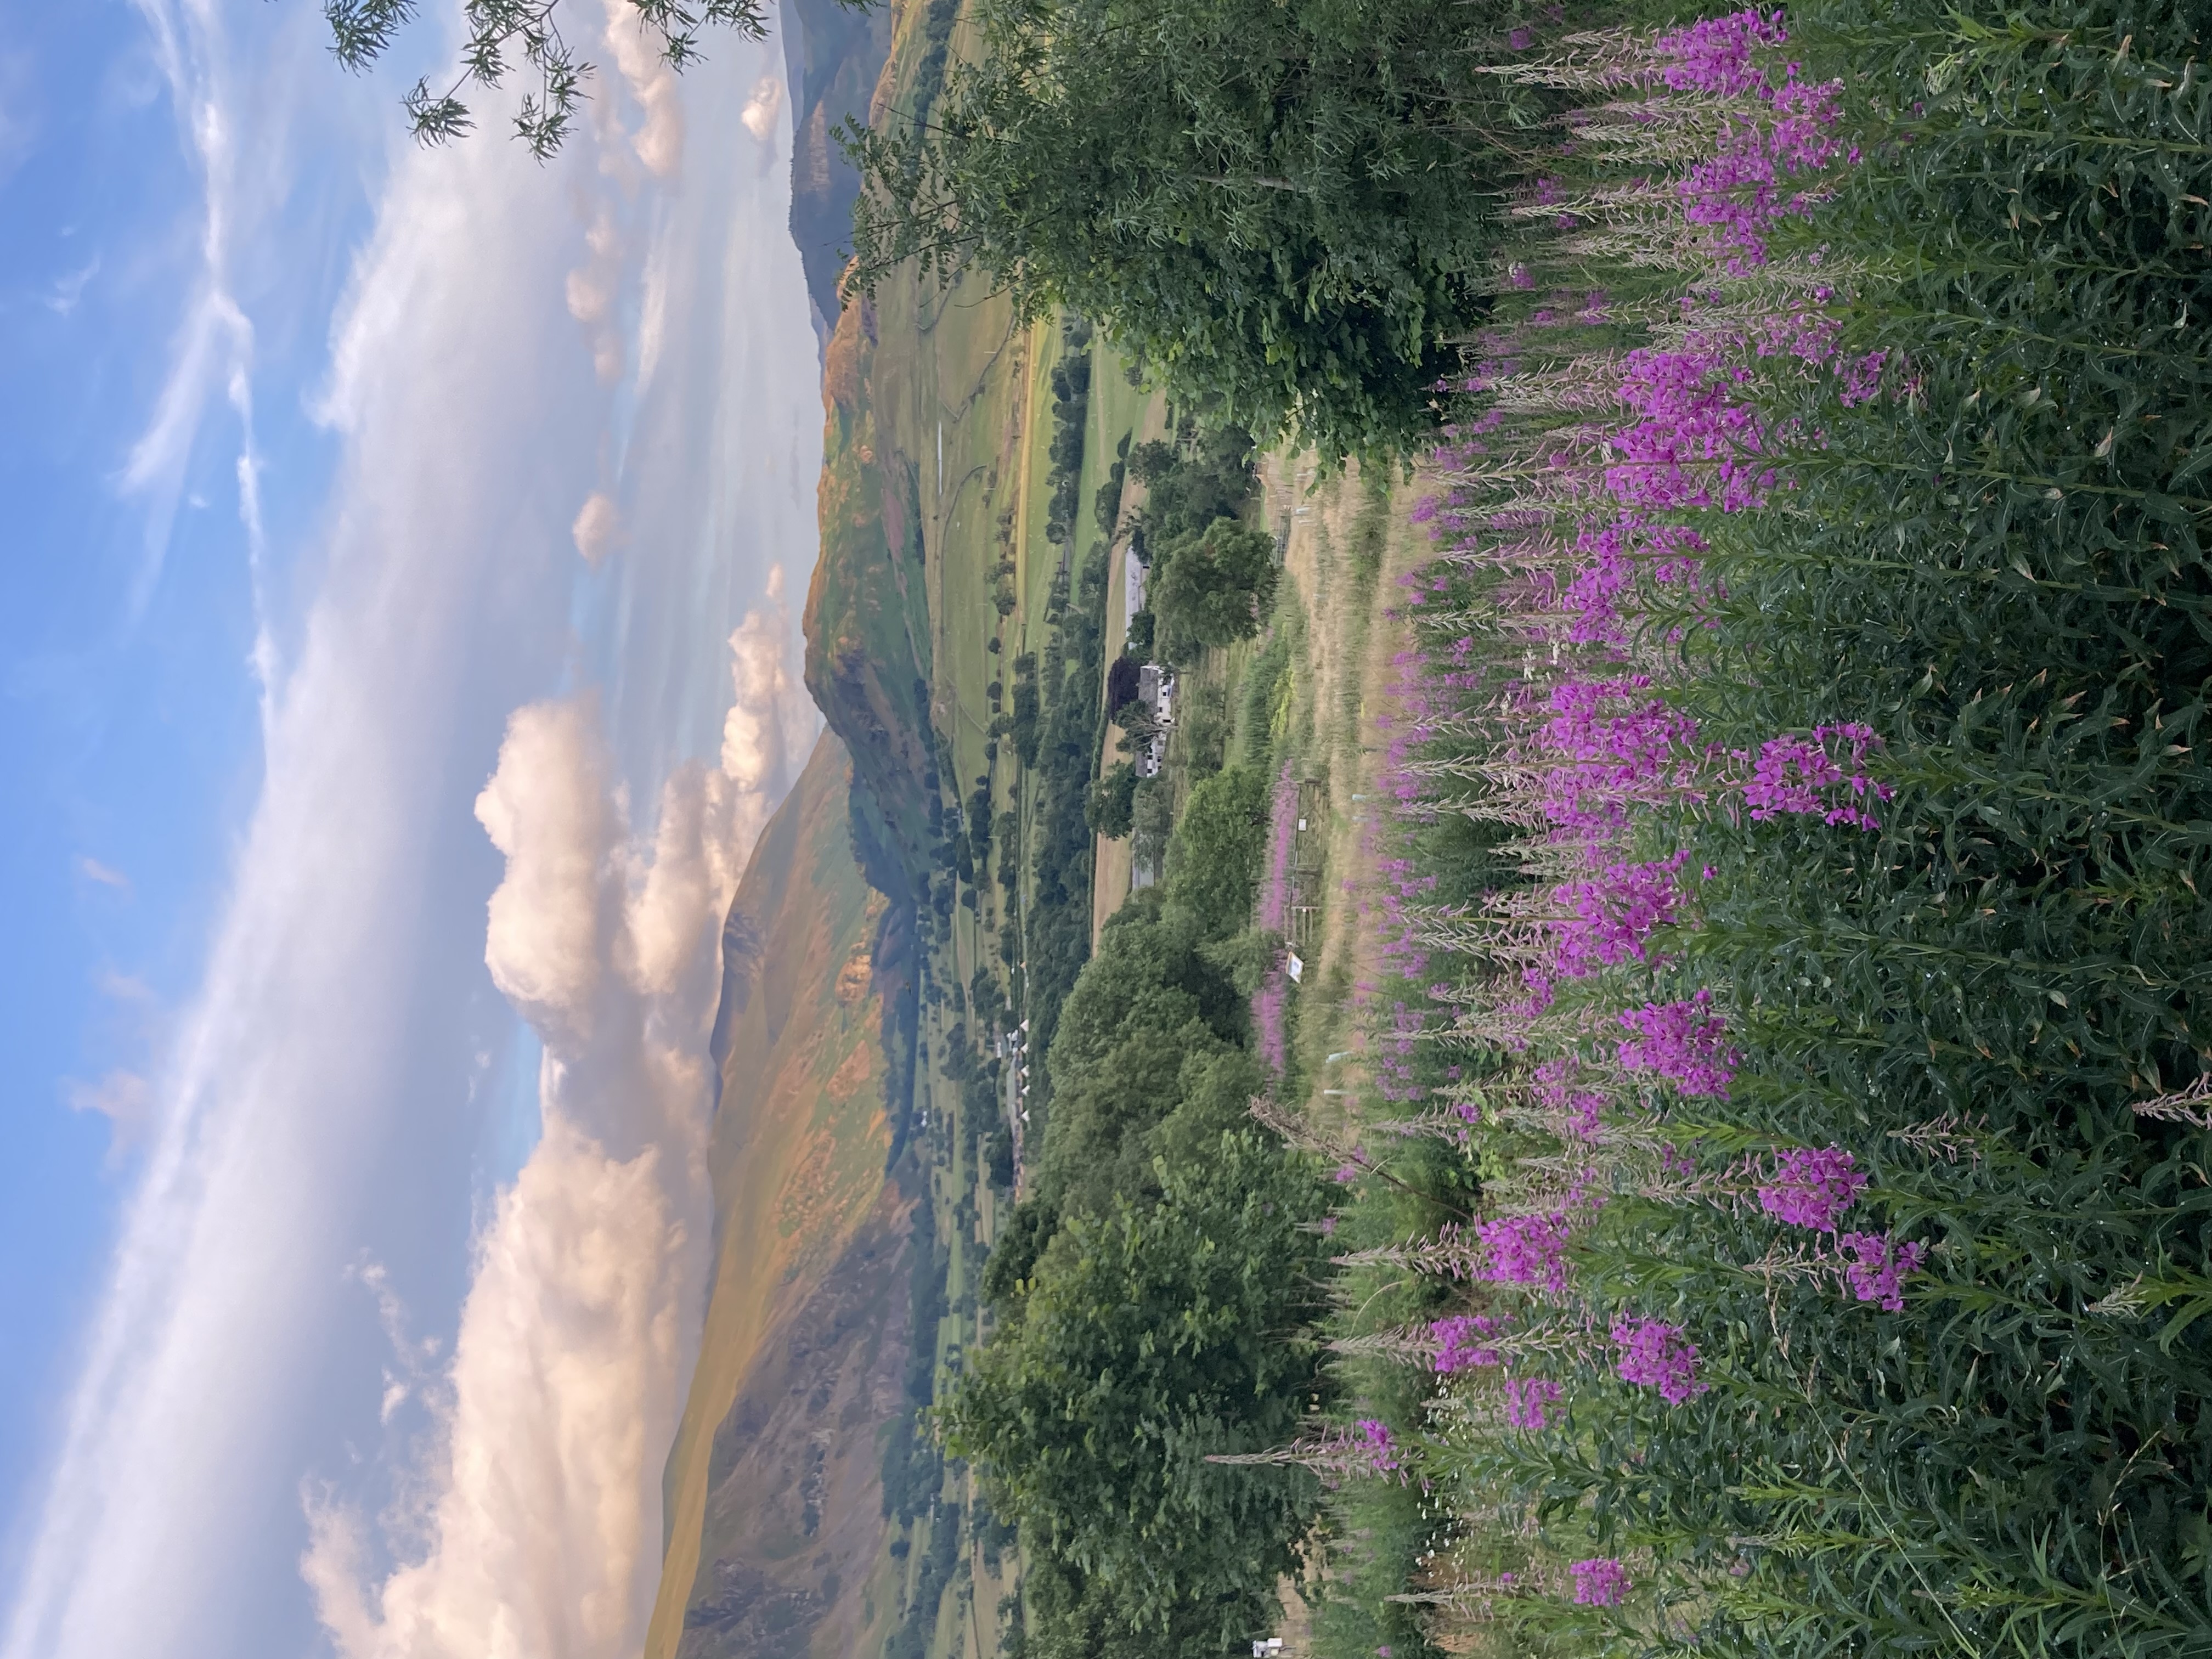
A beautiful view towards Helvellyn from Blencathra.
A range of physical factors have had an influence on the formation of landforms within the landscape.
Geology
The area has three main geologies:
- Skiddaw Group (or Skiddaw Slates - north; the oldest, sedimentary rocks formed 500mya by compaction and tectonic movement)
- Borrwowdale Volcanics (central; hard igneous rocks formed 450mya including Helvellyn and Scafell Pike (978m) with the largest mountains: it is less prone to erosion)
- Windermere Group (south; softer sedimentary rocks and limestone formed 420mya and have been eroded down)
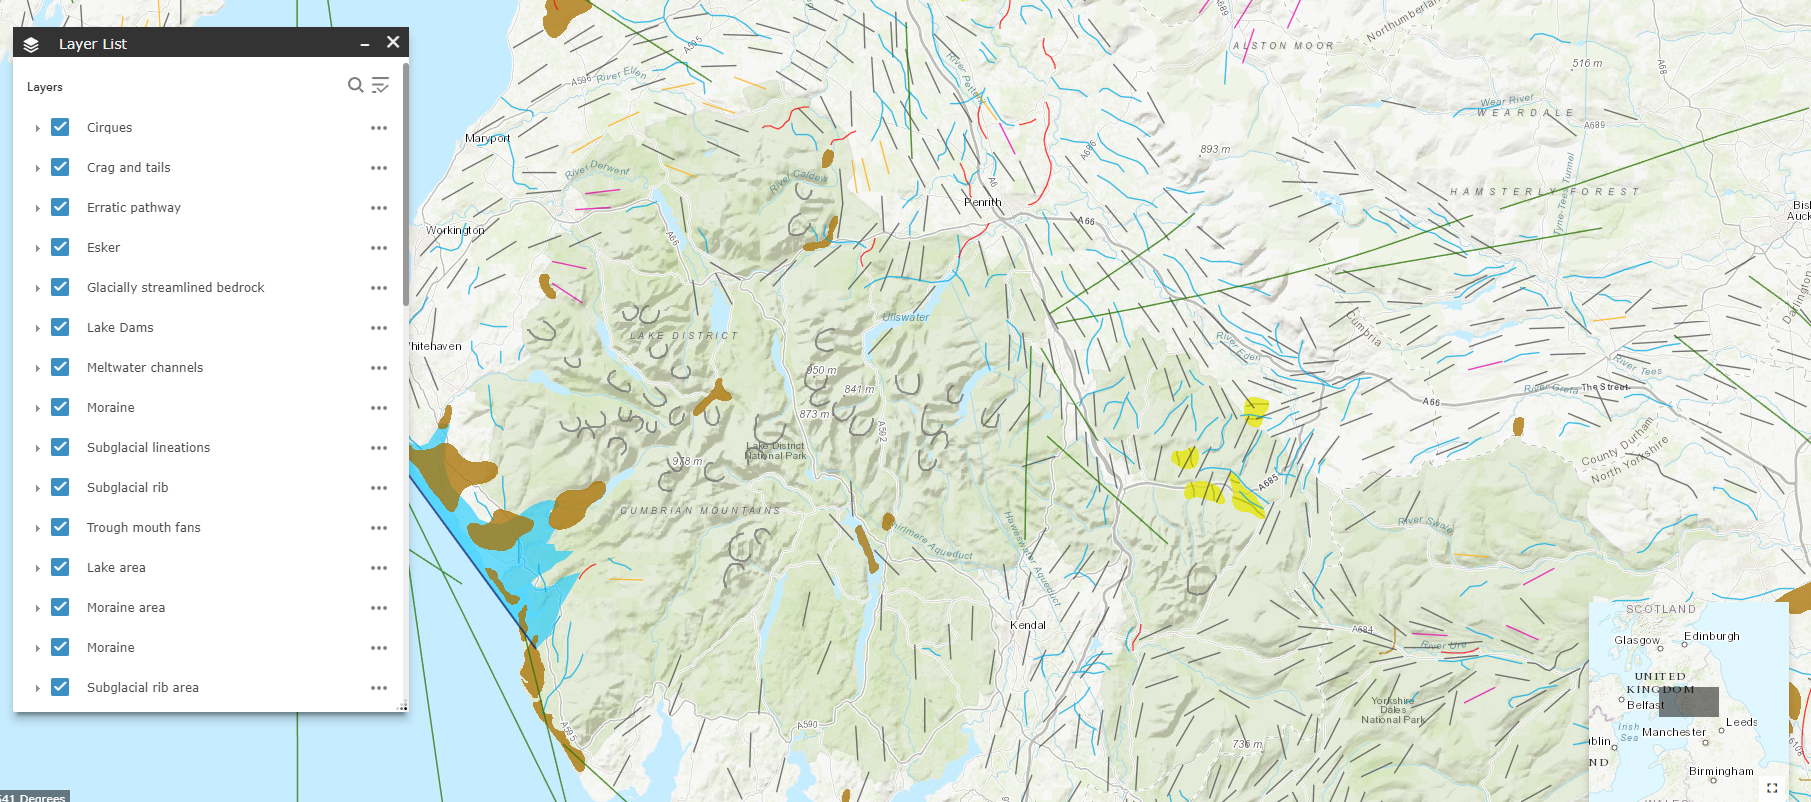
Glacial features of the Lake District, including subglacial lineations, meltwater channels, eskers, drumlins, moraines, glacially streamlined bedrock and more.
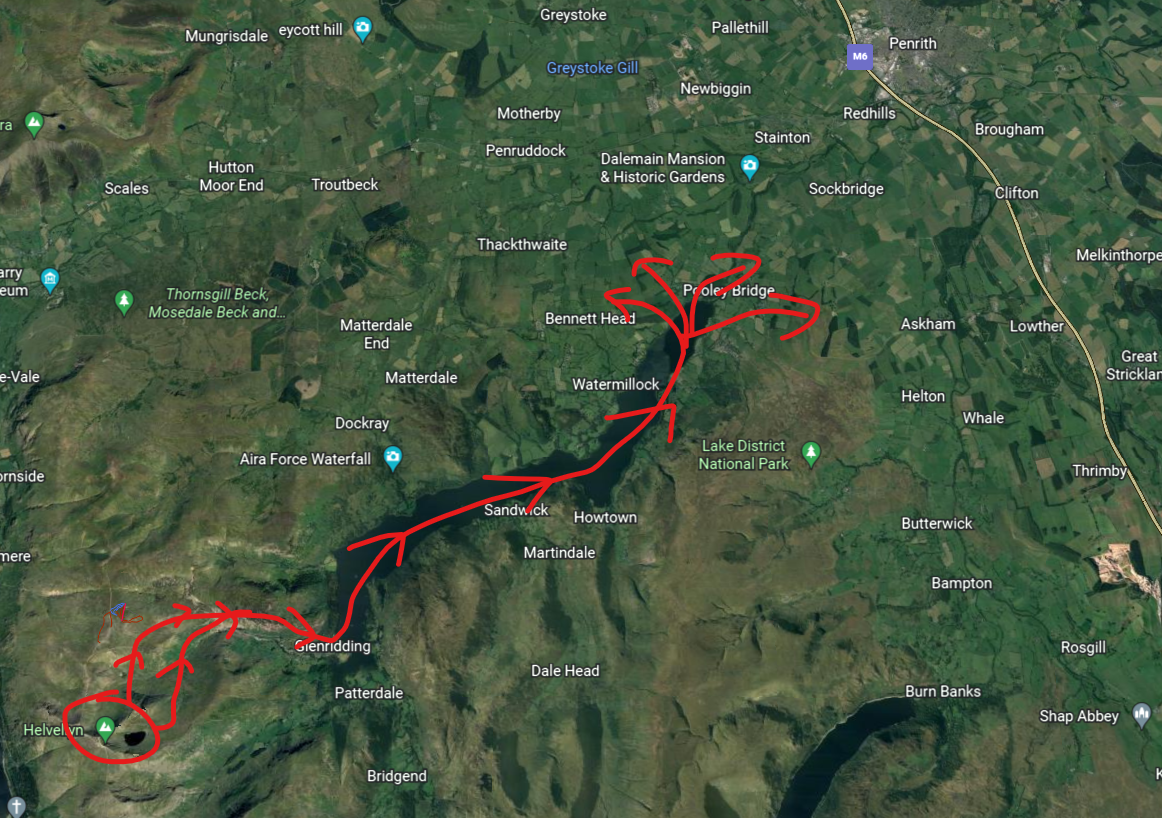
Helvellyn Range
Helvellyn is a 950m tall pseudo-pyramidal peak with aretes named Striding Edge and Swirral Edge separating the corrie from Brown Cove Tarn and Nethermost Cove, respectively. These corries are on the north-east side of the mountain. It’s not quite an official pyramidal peak as it only has these two named corries (but for all intents and purposes…).
Ice from Red Tarn at Helvellyn met with the Brown Cove Tarn ice, creating the Helvellyn Gill hanging valley. Flowing northeast into Glenridding Valley, it joined another larger glacier creating a glacial trough in present-day Ullswater. Likely exacerbated by compressing flow, where the ice mass moves slower, a long, thin, deep ribbon lake formed (as the flow made ice more likely to erode vertically). The varied geology also resulted in extending flow contributing to the ununiformityed nature of the U-shaped valley.
This glacier would have continued flowing north-eastwards, taking eroded material with it, towards modern-day Penrith, which is in a flat area, possibly resulting in the old Ullswater glacier becoming a Piedmont glacier when entering this more expansive, larger valley.
Lake District Landforms
Inside modern-day Ullswater is a series of roche moutonnées such as Norfolk Island and Lingy Holm. The geology of roche moutonnées is characterised by being more resistant than other local rock types, possibly with increased jointing and bedding, resulting in striation lines on the stoss, with the freeze-thaw weathering being visible on the lee side still today on these rock islands.
To the west of Helvellyn is the Thilmere ribbon lake. A series of truncated spurs and hanging valleys are located along this U-shaped valley, moulded by a glacier.
Drumlins made of boudlder clay have been deposited south of Kendal. They are oriented to the south-west visible here, supporting the idea that the ice was moving outwards from the area of higher topography to lower areas.
Langstrath Valley has an example of lateral moraine on the north side of it.
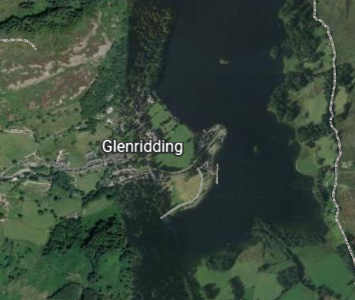
The Glenridding village has visible depositional till extending into Ullswater, visible from satellite imagery, proving that there was once glacial activity in the area.
Essay snippet: inter-related valley landforms
Using a case study, assess the extent to which landforms within a valley glacier are interrelated [16 marks]
Plan
- Formation of corries, aretes and pyramidal peaks: Helvellyn, Red Tarn and Nethermost Cove. Overdeepening caused by nivation, plucking on the back wall, and rotational slip causing the armchair shape - only possible because each are interrelated.
- Back to back erosion w/Nethermost Cove: striding edge arete
- Ice flowing from Red Tarn into Glenridding valley creating Helvellyn Gill and joining with another larger glacier - Ullswater, geologies creating roche moutonnées and deepening of lake. Material from erosion upvalley deposited as sediment visible in the lake today
- Erratics may appear to be not interrelated but from erosion - partly related. Longer distances. Till also forms drumlins typically in flatter areas further away - lodgement till
- Overall, undeniable evidence that all landforms are interrelated through the linked processes of erosion and deposition - with erosion acting as the prerequisite for subsequent transport and deposition.
Essay (note: to rewrite!)
A corrie, or cirque, is formed by snow falling and compacting in a hollow over many winters, typically on the northern side of mountains in the northern hemisphere due to the sheltered aspect, and cooler microclimate. Over time, snow accumulates, compacting the snow beneath it into ice due to the air inside being displaced. The back wall of the mountain, for example, Helvellyn in the Lake District, gets increasingly steep due to persistent freeze-thaw weathering and plucking of material, which then gets entered into the young glacier system as englacial material, or lands on the surface as supraglacial material.
At the same time, under its own weight, the ice at the base begins to rotate, known as rotational slipping, deepening the base through abrasion, with this abrasive material being finer sub-glacial debris. At Helvellyn, the bedrock type is known as the Borrowdale Volcanics, having formed 450 million years ago and moved from tectonic forces. Despite this relative strength due to its more joined and bedded geology, several corries have formed, and their contained glaciers have melted throughout the Pleistocene period. After the most recent glaciation period known as the Loch Lomond Stadial around 12,000 years ago, there exists a corrie containing Red Tarn on Helvellyn’s north-easterly side. These corries have eroded back to back, resulting in the formation of an arête, shaped like a knife, namely Striding Edge, and Swirrell Edge on the alternate side of this corrie. Furthermore, Red Tarn has a lip, helping to prevent water loss, as a result of rock and moraine deposits left by the glacier.
These examples clearly show the significant extent to which landforms in a valley glacier system are interrelated between different erosional landforms, from the initial snowflakes settling in a hollow to the creation of many other landforms during and after glaciation has occurred.
Ice Sheet Case Study: Minnesota
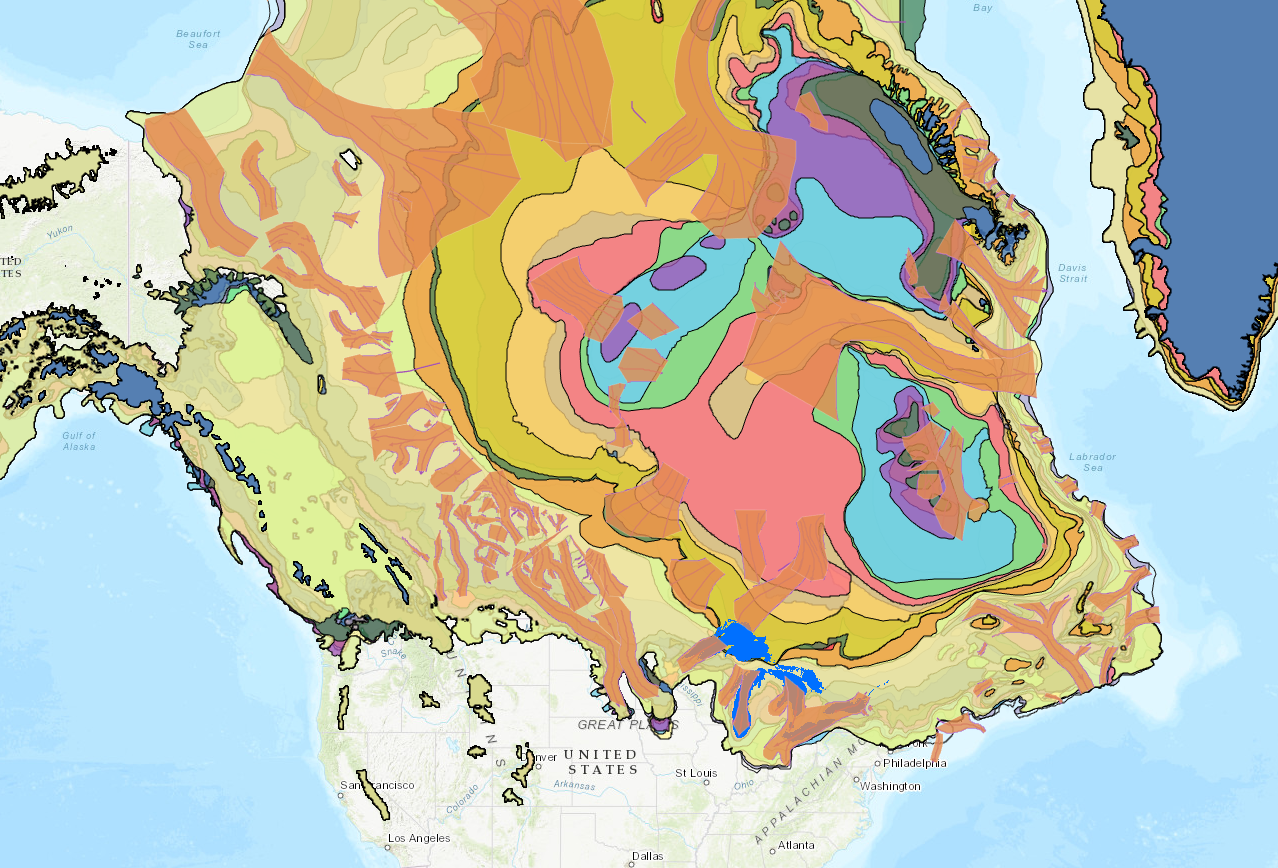
The Laurentide Ice Sheet during various glacial stages
The Laurentide Ice Sheet was a huge ice sheet, up to 2 miles in height in some places, with cycles of growth and retreat several times over the Quaternary period, from over 2mya to… today!
The geology of Minnesota is varied. There are alternating bands of igneous and sedimentary rocks. In the north, a range of mountains several kilometeres high was created by tectonic compression, made of strong metamorphic gneiss. In the Arrowhead region in the northeast, located near to Lake Superior, tectonic tilting has exposed weaker, lesser-jointed shale rocks.
Its last advance occurred between around 100kya and 20kya, where subglacial erosion carved out areas of North America, from the huge Hudson Bay to the hundreds of thousands of smaller lakes present in Minnesota and Canada, such as Mille Lacs Lake in an ellipsoidal basin. The mountains were eroded; now Eagle Mountain, the highest, is only 701m high. Part of Lake Superior and other Arrowhead region lakes were deeply eroded thanks to their weaker geologies.
As it made its final retreat, meltwater was blocked by the ice and the large “Big Stone Moraine”, forming Glacial Lake Agassiz. It was larger than every Great Lake combined, covering around 300,000 square kilometres, around the same size as the present-day Black Sea. With continued ice ablation, a glacial lake outburst flood (GLOF) occurred as the moraine was overtopped, around 11,000 years ago, resulting in large-scale erosion of an area 8km wide and 76m deep in Browns Valley, Minnesota. This old river is known as the Glacial River ‘Warren’, helping to carve out the modern Minnesota and Mississippi rivers, and the valley present today. With the water came deposition: large swathes of fertile silt and soil deposits have been left behind in the valley, likely from the Big Stone Moraine. It took around 2,000 years for the lake to fully drain, and it likely had a large impact on the climate, sea level and even early civilisation! [simplified]

The top left is the bed of Lake Agassiz, and the eroded area is visible too. North Minnesota.
If you’re interested, an interactive map of the glacial extent and lobes is available here, thanks to the brilliant geographers over at Royal Holloway.
Ice Lobes
There are three phases of the glaciation period you need to know, with four associated lobes. Lobes themselves form because ice wants to move under gravity, and with the Laurentide ice sheet at 2 miles high, the base of the ice sheet was under significant pressure. The thickness of the ice above, topography of the land and geology have an impact on how lobes form. In areas of lower resistance such as a valley, ice can be channelled and advance faster, forming the lobes.
Wadena Lobe
The Wadena Lobe was the first of the four main lobes that were on top of Minnesota. Arriving around 30kya, the lobe came in from the north to north-west and is characterised by the deposits it created, being from red sandstone, shale and limestone.
This deposition produced the Alexandra and Itasca moraines, forming the tilly Wadena Drumlin Field over the Wadena, Otter Tail and Todd counties, and its ground moraine reached just south of the present-day Twin Cities.
Rainy and Superior Lobes
The Rainy Lobe moved in from the north to northeast of Minnesota and deposited the St Croix moraine, made of greyish, brown greenstone around 20kya.
The Superior lobe came in from the northeast at the same time. Partially covering present-day Lake Superior, it deposited a series of basalt, red sandstone and greenstone till moraines extending southwards to the Twin Cities. Like Wadena, it too deposited drumlins.
Des Moines lobe
The Des Moines Lobe was active during the most recent glacial period (LGP), around 13kya. It moved in from the northwest, covering vast expanses of the west of the county from the most northerly point to the most southerly point. It deposited till that is tan to buff coloured and is clay-rich and calcareous due to its shale and limestone source in the northeast. In the southwest, the Prairie Coteau region has examples of terminal moraine, and outwash plains. Many of this lobe’s deposits are over 160 metres deep in the region.
Post-glacial modification
Isostatic readjustment occurs when these ice sheet glaciers retreat due to the land not being under pressure anymore. This land then typically rebounds upwards and elevations increase in the area where glaciers once lay. Fluvial activities continued to mould the landscape after full glacial retreat had occurred.
Glacio-fluvial landforms
(Date studied: 23/11/2022)
Glacio-fluvial means an environment shaped by glacial meltwater.
Geomorphic means changes (morph) to the land (geo).
Glaciofluvial landforms are formed as a result of climate changes
Eskers
Eskers are long, sinuous (many curves and turns) ridges made from sand, gravel and other types of glacial till deposited on valley floors by glacial meltwater flowing through subglacial and englacial tunnels.
Eskers are “elongated ridges of glaciofluvial sediment deposited by subglacial meltwater pipes”.
These tunnels and channels over time become filled up with sediment. During deglaciation, this sediment is dropped onto the bedrock leaving stratified ridges, signifying that a glacial meltwater tunnel was somewhere above it. This could be either a kame (see below) or an esker.
The general consensus is that the deposition is caused when pressure is released at the glacier’s snout, so as the glacier retreats, the point of deposition retreats too. This can describe their beaded appearance (vary in height and width throughout) with the beads of greater size representing periods of relatively slow retreat, or halted ablation. Others may say that the larger beads are caused as a result of the greater load carried by the meltwater in the summer seasons.
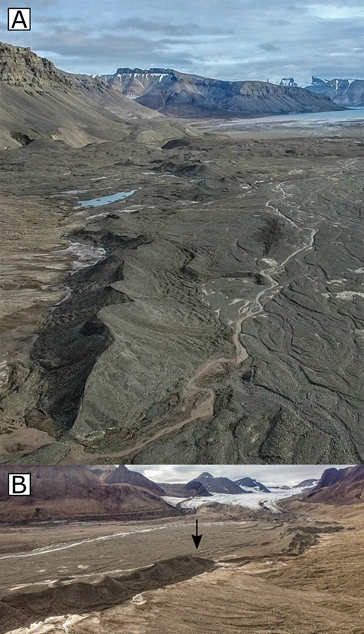
Here are 2 angles showing what they look like, in Svalbard.
The weight of the ice above the subglacial tunnels means that the water flowing within these subglacial tunnels is under extremely high pressure. When the ice melts, this pressure is released, so therefore dropping sediment.
Eskers are deposited unaffected by/ignorant of local topography, meaning that they can traverse over hills in the landscape.
The path taken by this pressurised meltwater is mostly controlled by the slope, size and direction of the ice surface rather than the bedrock. Because of this, eskers can be used to show the slope of the ice surface, as well as its extent! It also runs parallel to the direction of ice flow, running transverse to the glacial snout.
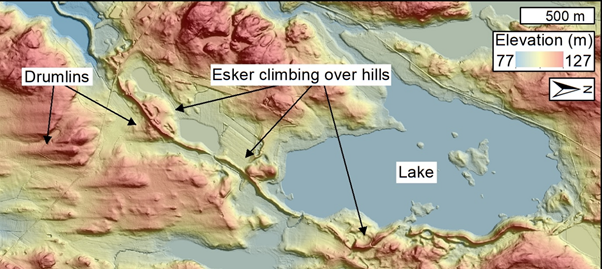
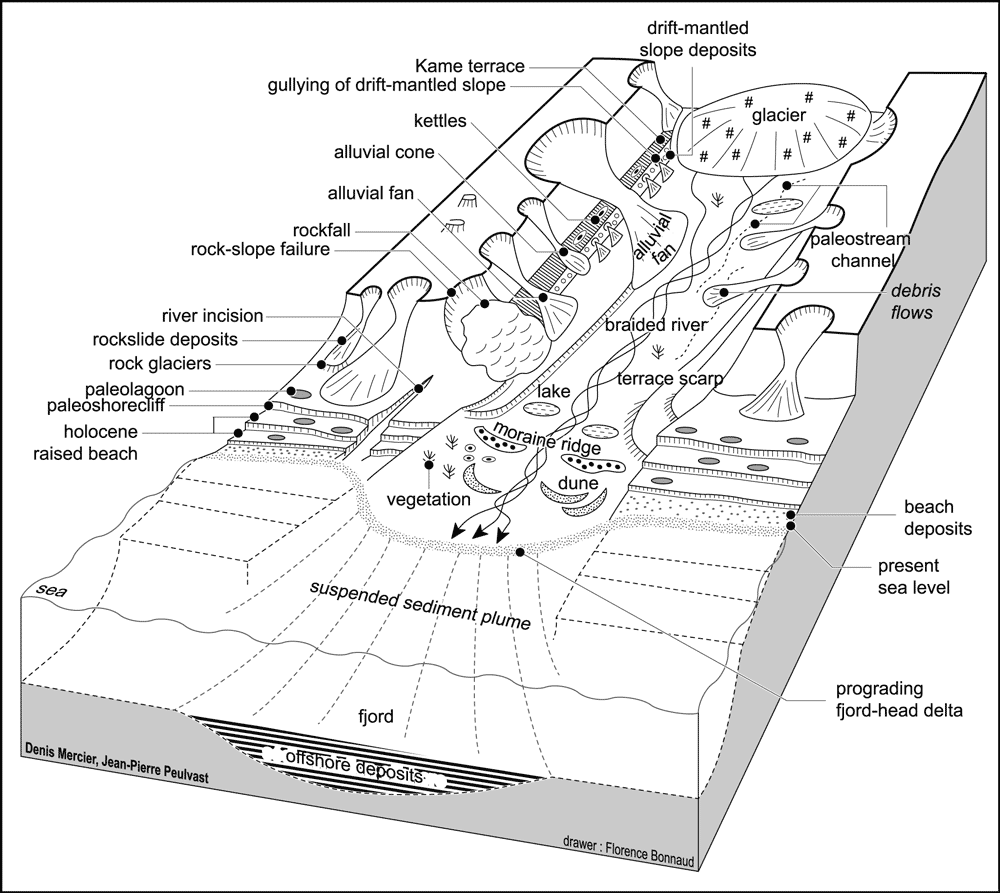
Topographic view of depositional landforms.
Eskers on paleo-ice-sheet beds are more abundant in areas of crystalline bedrock with thin coverings of surficial sediment than in areas of thick deformable sediment, because meltwater flowing at the bed is more likely to incise upwards into the ice to form an R-channel where the bed is hard; where the bed is deformable, meltwater is more likely to incise downwards.
You don’t need to remember that.
Examples
Many eskers are found in central Ireland, some are in Canada, as well as many in Iceland and Sweden.
Here is an example of an esker on Google Maps.
A meltwater stream is visible south of it, as well as another esker to the east.
Post-glacial climate change in Eskers
During periods of increasing global climatic temperatures, the rate of glacial ablation increases and results in more meltwater being produced. This means that there is more accumulation of sediment in proglacial areas and the length of these eskers is likely to increase or become more beaded with greater and more intense ablation periods. With faster glacial ablation, eskers will be exposed in greater number.
Kames and Kame Terraces
A kame is an irregularly shaped hill, hummock or mound made of stratified glacial till comprised of mainly sand and gravel.
There are two types of kame:
Delta kames
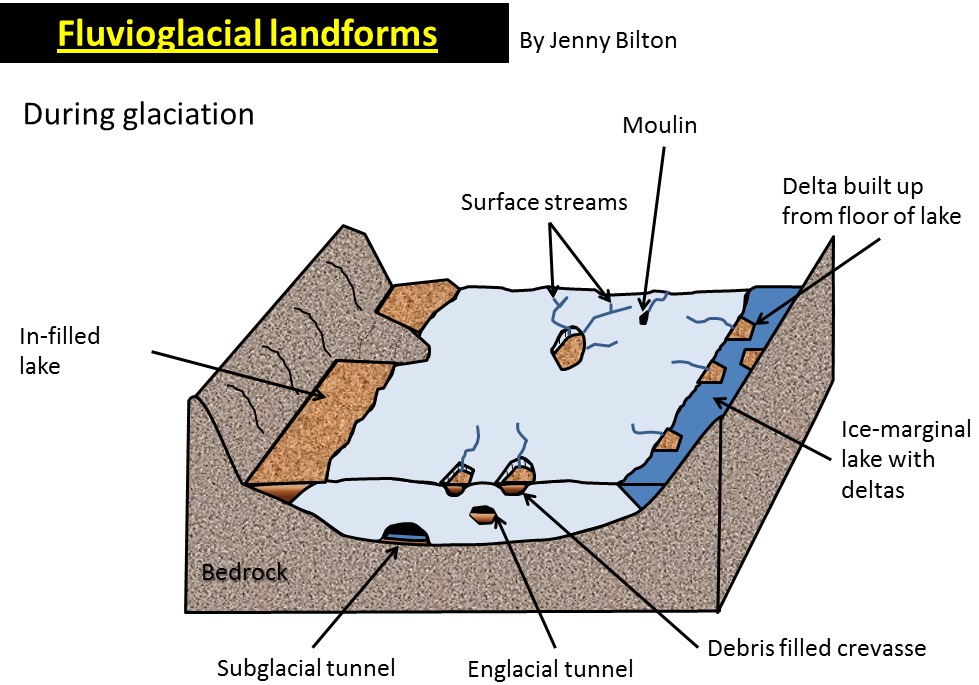
Delta kames can form in two main ways. Firstly, they can form due to the build-up of debris in englacial tunnels or crevasses that emerge at the glacial terminus as a result of retreat. As a result, they lose their energy, and are forced to deposit their contained load.
Another way that they can be formed is when supraglacial streams meet ice-marginal lakes. These ice margin water bodies are largely static (just sit there tbh) so the sediment they carry loses energy and gets deposited in the lake, from where this supraglacial stream enters it, often leading to a tall accumulation.
Kame terraces
Kame terraces are ridges of material near or on the valley margin. They are largely comprised of ex-lateral moraine, which was transported into the ice-marginal lake due to the supraglacial streams formed due to the warming of ice through friction with valley walls. As this is largely glacio-fluvial, unlike morainic deposits, these are somewhat sorted and stratified by the movement of water. When the glacier retreats, this sediment is dropped and collapses onto the bedrock floor.
Watch out! Many people say ‘kame’ when they mean ‘esker’! You need to know the differences between the two well. (main one is eskers are subglacial, kames are not)
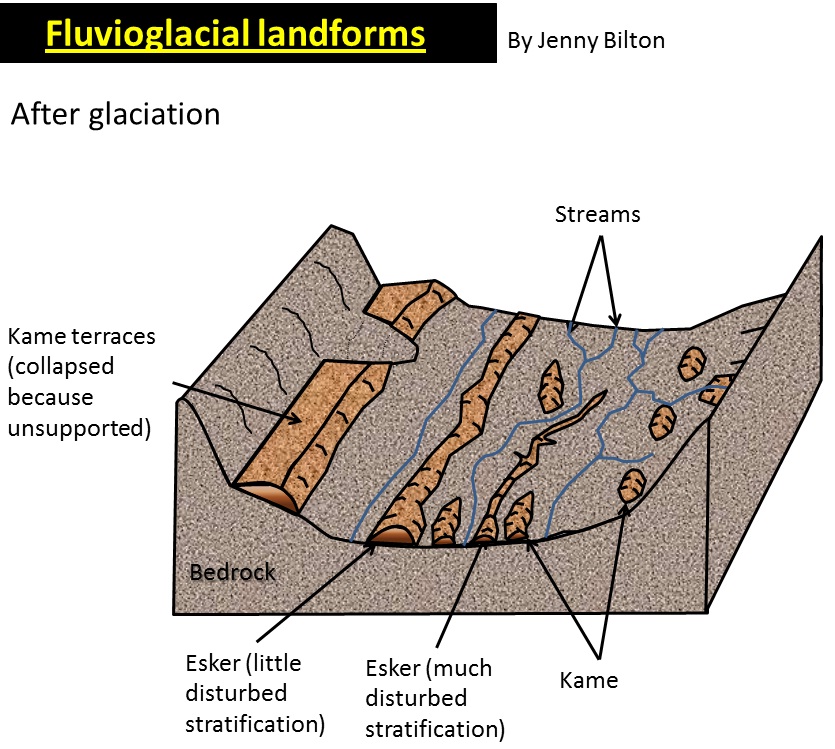
This displays between kame and esker.
As climate change increases temperature levels, more meltwater is present, which transports and deposits sediment. This will result in a larger amount of all types of kame being more likely to form.
Here is an example of an esker on Google Maps: https://www.google.com/maps/cheatsheet-esker-link
A meltwater stream is visible south of it, as well as another esker to the east.
Essay example: influence of climate changes and geomorphic processes in their formation
Kames are mounds of sediment deposited by glacial meltwater or ice, found in areas where glacial ice melted and receded, leaving behind sediment deposits. The process of kame formation is complex and is a result of a variety of interrelated factors, including climate change and geomorphic processes.
Climate change is one of the most significant influences on the formation of kames. During the Pleistocene epoch, large areas of the northern hemisphere were covered in thick glaciers. As the climate warmed and the glaciers receded, large volumes of meltwater were released, carrying sediment with it. The sediment was deposited in stratified piles, forming these kames, visible in places in the UK such as the Scottish Highlands or the Lake District. This can be proven to be the result of a glacio-fluvial deposition as they are deposited in one go by melting ice, while previous meltwater surface streams moved the sediment into crevasses or glacial marginal lakes.
Geomorphic processes also play a role in the formation of kames. As the glacier erodes the landscape, valley sides’ sediment may fall onto the glacier, ranging from large boulders to sand grains. The size and shape of these kames vary depending on the type of sediment deposited, as well as the rate of erosion. In addition to erosion, other geomorphic processes can play a role in the formation of kames such as weathering. These processes such as frost-shattering and chemical weathering can break down sediment particles and form smaller particles that can be easily carried by wind or water. This can cause further accumulation of sediment in certain areas and contribute to the formation of kames. Lithification may also occur when the sediment is compacted and cemented together, forming a solid mass among the trapped sediment.
In conclusion, climate change and geomorphic processes are both important factors in the formation of kames. Climate change causes the glaciers to melt, releasing large volumes of sediment, which is then deposited in strata. Geomorphic processes, such as erosion, sedimentation, and lithification, also contribute to the formation of kames. Together, these two factors contribute significantly to the formation of kames, alongside many other factors like the topography, aspect and relief of the local region.
Proglacial lakes
Proglacial lakes form in front of glaciers, usually when meltwater streams become blocked by terminal moraines, glacial dams (trapped against a large ice sheet) or due to isostatic depression of the lithosphere into the weaker asthenosphere.
The meltwater, over time, accumulates in this area, unable to flow outwards. This is similar to how a traditional valley glacier system starts with the corrie melting and a tarn being left due to a terminal moraine blockage.
After a glaciation period, the climate typically warms up. Over time, if there is a large ice sheet blocking the water flow, this sheet will ablate, and the lake will either overflow or undermine the dam, causing a glacial lake outburst flood, or jökulhlaup.
Modern example: The Russell Fjord in Alaska is regularly blocked by the Hubbard Glacier, which can increase water levels in the fjord by up to 15m as it cannot empty out into Disenchantment Bay: Google Maps/3D Google Earth.
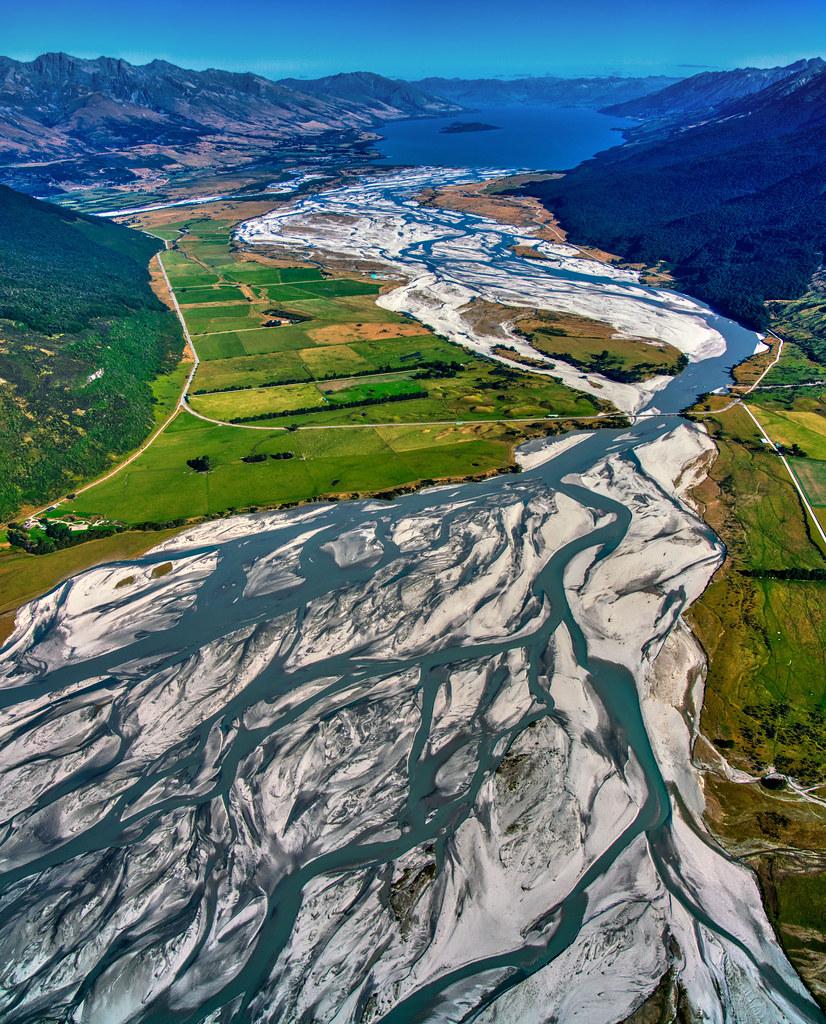
Outwash plains
Outwash plains are also known as sandurs. They are dominated by other landforms, including braided streams and kettles. They occur in front of melting glaciers, and are mostly flat and expansive areas. Meltwater traversing this terrain has little energy, and therefore little vertical erosional power and is more inclined to deposit material. As a result, these flat areas are created from stratified (strata; layered) sediment.
As the glacier moves over bedrock, plucking and abrasion (erosion) occurs resulting in silt and sediment being carried in this meltwater. Braided streams are dominant in outwash plains. These are very shallow streams and rivulets which carry and redeposit till due to the little energy in the system.
In summer months, there is typically higher glacial discharge and ablation, resulting in these tilly islets being destroyed by water, which has a little more energy due to increased velocity. This leads to more erosion, and these islets then go on to reform later. This makes the outwash plain have a distinct look. This can be described as dynamic.
The elevated level of erosion is typically closer to the glacial snout but then progressively loses energy.
In areas that were once glaciated, old outwash pains can be found by looking for sediment, with large angular rocks and boulders being present closer to the glacial mass and smaller, smoother rocks and sediment being further away from the glacier, similar to a typical river system aside from their origin. Outwash plains can extend for miles beyond the glacial margin (terminal moraine).
Braided streams
The general consensus is that braided rivers form instead of meandering rivers due to a higher sediment load, caused by discharge from ablation, as well as variable rates of flow.
At the end of a melting period, these lose water, lowering kinetic energy present in the system and therefore losing erosional power and increasing depositional power.
This results in material being deposited into the river channel, causing it to divide in two. Braiding itself develops when this ‘mid-channel bar’ grows downstream, as a result of more, finer material being added to the bar as discharge amounts continue to decrease. These bars, during times of exceptionally low discharge like in winter months, may become home to vegetation, becoming even more permanent. whereas unvegetated bars are less stable and often move with high discharge.
Many of these channels branch from other channels and merge to give it the ‘braided’ pattern. They are common in outwash plains due to the variable nature of ablation and meltwater amounts.
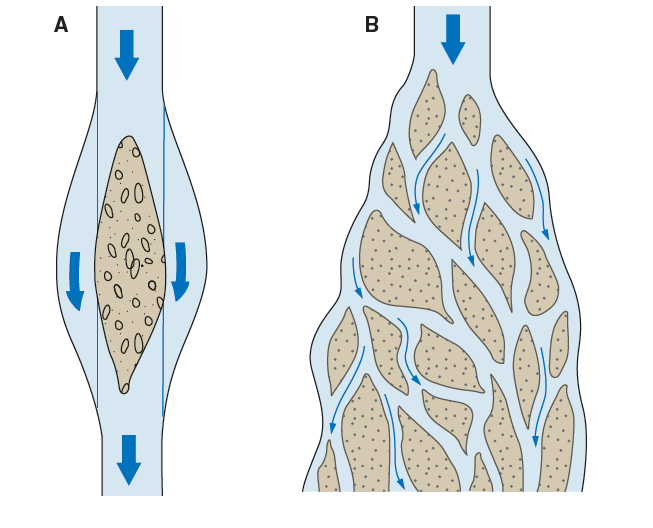
diagram of a braided stream
They are found in large quantities in south Iceland, for example.
Due to climate change, braided streams may dry up due to smaller amounts of ice present in these areas, after an initial increase in ablation due to temperature rise. This initial increased sediment load will progressively decrease as the ice mass decreases.
As a result, there can be expected to be more eroded streams, being deeper and wider, inside this outwash plain, followed then by the arebea becoming dry and tundra-like. Whilst vegetation thrives in outwash plains due to the rich minerals present in the glacial meltwater, this may also dry up in the future, becoming a barren, sandy and gravelly area with little life, or could be taken over and reclaimed by plants depending on resource availability.
Is that a braided stream AND a proglacial lake inside a valley glacier system?
Photo from Jonas Mendes.
Kettles
A kettle is a large depression in the ground formed by glacial deposition and is therefore a depositional landform. They create ‘dimples’ in the landscape around mountainous areas.
They are formed by large blocks of ice breaking from the main glacier. As the main glacier retreats, this ‘dead’ ice becomes stranded and, over time, becomes buried by sediment deposits as meltwater flows around it from the main glacier. Of course, this ice melts and its water evaporates, leaving behind a large depression, or kettle holes. Water can then fill these in again, or if not all water drains originally, resulting in kettle lakes.
Periglacial landforms
Periglacial landforms exist as a result of climate changes before and/or after glacial periods.
Periglaciation is concerned with the process and landforms attributed to the action of permafrost. Typical processes include freeze-thaw.
Being in a periglacial area means an area that is near to, or on the fringe of, glacial areas’ ice mass, such that permafrost is present. This means that there is no physical glacier system present in the area, but it is still cold, relative to surrounding environments.
Permafrost
This is also part of the Earth’s cryosphere, as well as glaciers, ice sheets, and more!
Permafrost itself is comprised of:
- the active layer (this is the top few metres or so. It is warmer as it is closer to the surface. It may become unfrozen during the summer months and vegetation may grow too.)
- the permafrost layer itself.
- talik (year-round sections of unfrozen ground, soil, and rocks that lie in permafrost areas, but itself is not frozen)
There are 3 types of permafrost:
- Continuous permafrost: there is little thawing, even in the summer. These are often in areas of high altitude and latitude.
- Discontinuous permafrost: There are some patches of consistent permafrost, but are broken up by talik extending to the active layer
- Sporadic permafrost: small amounts of permafrost largely enclosed by talik
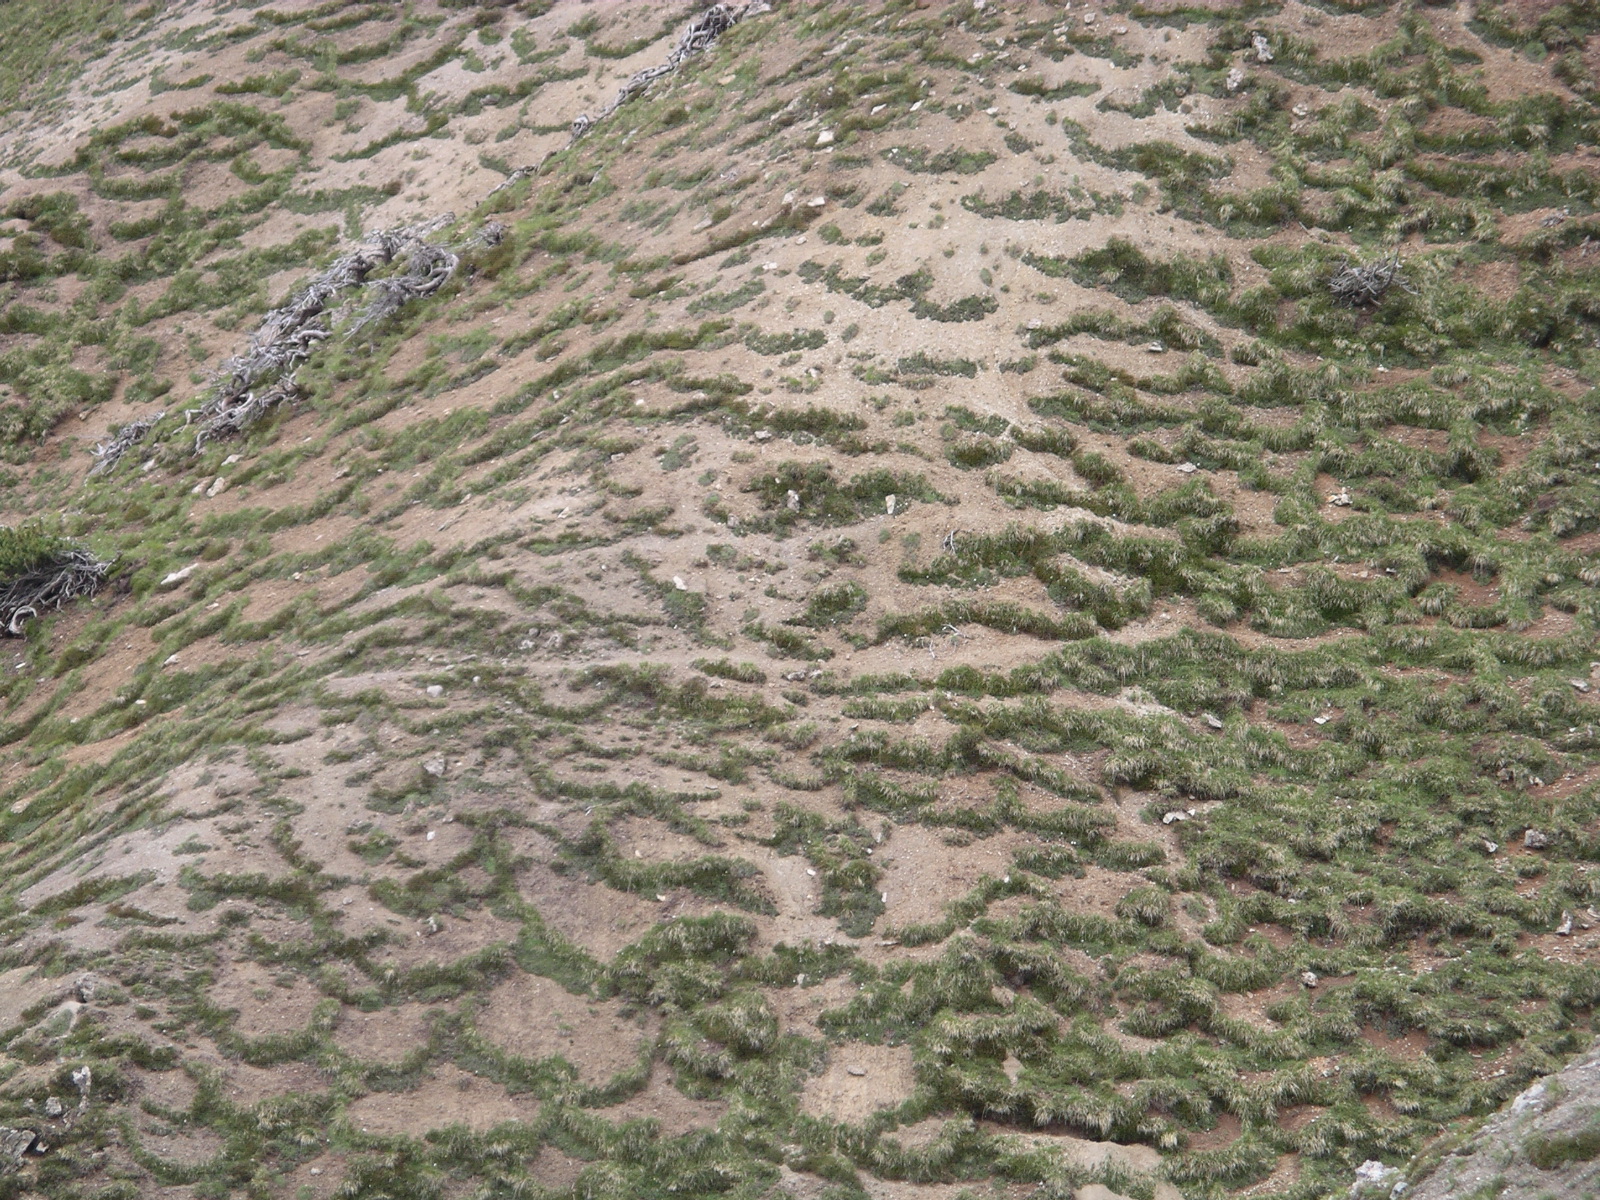
Patterned ground
This encapsulates sorted stone polygons, stone stripes, etc.
These landforms are facilitated by the process of frost heave. Stones within the ground and active layer have a lower specific heat capacity, allowing them to cool down and heat up faster than their surrounding soil. Due to the freezing conditions, water below the stones freezes as well, and also expanding by 9%, pushing the stones upwards. Over time and many years potentially, the stones are pushed to the surface, and to a larger extent, the frost heave sorts all fine and larger material too, creating a domed surface! How exciting.
Stones which are on top of this dome then fall down to undomed areas because of gravity. This is typically every 1 to 3 metres. These rows of stones can end up connecting and forming polygonal shapes.
On slopes, between 3 and 50 degrees, these polygons become warped and are known as elongated stone polygons, or garlands. On even steeper terrain these become stone stripes.
Blockfields
Lord help me if this comes up in the exam (I am not religious)
Blockfields are believed to be formed as a result of chemical and mechanical weathering below the active layer in periglacial regions such as plateaus or mountain tops, as these are typically glacial fringe regions rather than ice-covered areas.
Over time, these processes produce an uneven, angular & bouldery landscape which is only revealed after the permafrost layer melts away, forming ‘in situ’ (alternatively by rock glaciers - which are glaciers containing a large amount of frost-shattered rocks.). Blockfields potentially formed 23 million years ago during the Neogene epoch, when the climate was relatively warmer than today; higher amounts of chemical weathering then initiated the (very slow) process of eroding formed bedrock.
Resistant rock, or tor, may be more prominent in these blockfields as they are not as susceptible to denudation (erosional processes).
On slopes above a gradient of 25o, block streams/stripes are formed as gravitational forces will move this material down a slope.
Types of mass movement
Solifluction lobes
Solifluction is the movement and “flowing” of soil and sediments
When the ground and soil on slopes is frozen during the winter, the soil particles are separated slightly and loosened by the ice which forms and expands by around 9% between these particles (frost heaving).
During the thawing of the active layer in the spring and summer months, water saturates the ground as it cannot drain easily (due to the impermeable, frozen permafrost below - it is forced to stay in the upper layer) or evaporate due to the cooler climate. Friction is reduced between these particles, which are already loose after the freezing months, as this water can lubricate them. As a result of this excessive lubrication, the soil moves downslope easily. (The extra mass from the water can also help with this.)
Soil/Frost Creep or Mass Wasting
This is a process which moves material down a slope by a few centimetres per year even on high gradients.
When the soil freezes, the particles within the slope are lifted vertically at a 90-degree angle to the slope. As the soil thaws and the particles settle, they end up slightly lower than their original position. This process is repeated over time, gradually causing the slope to shift downward.
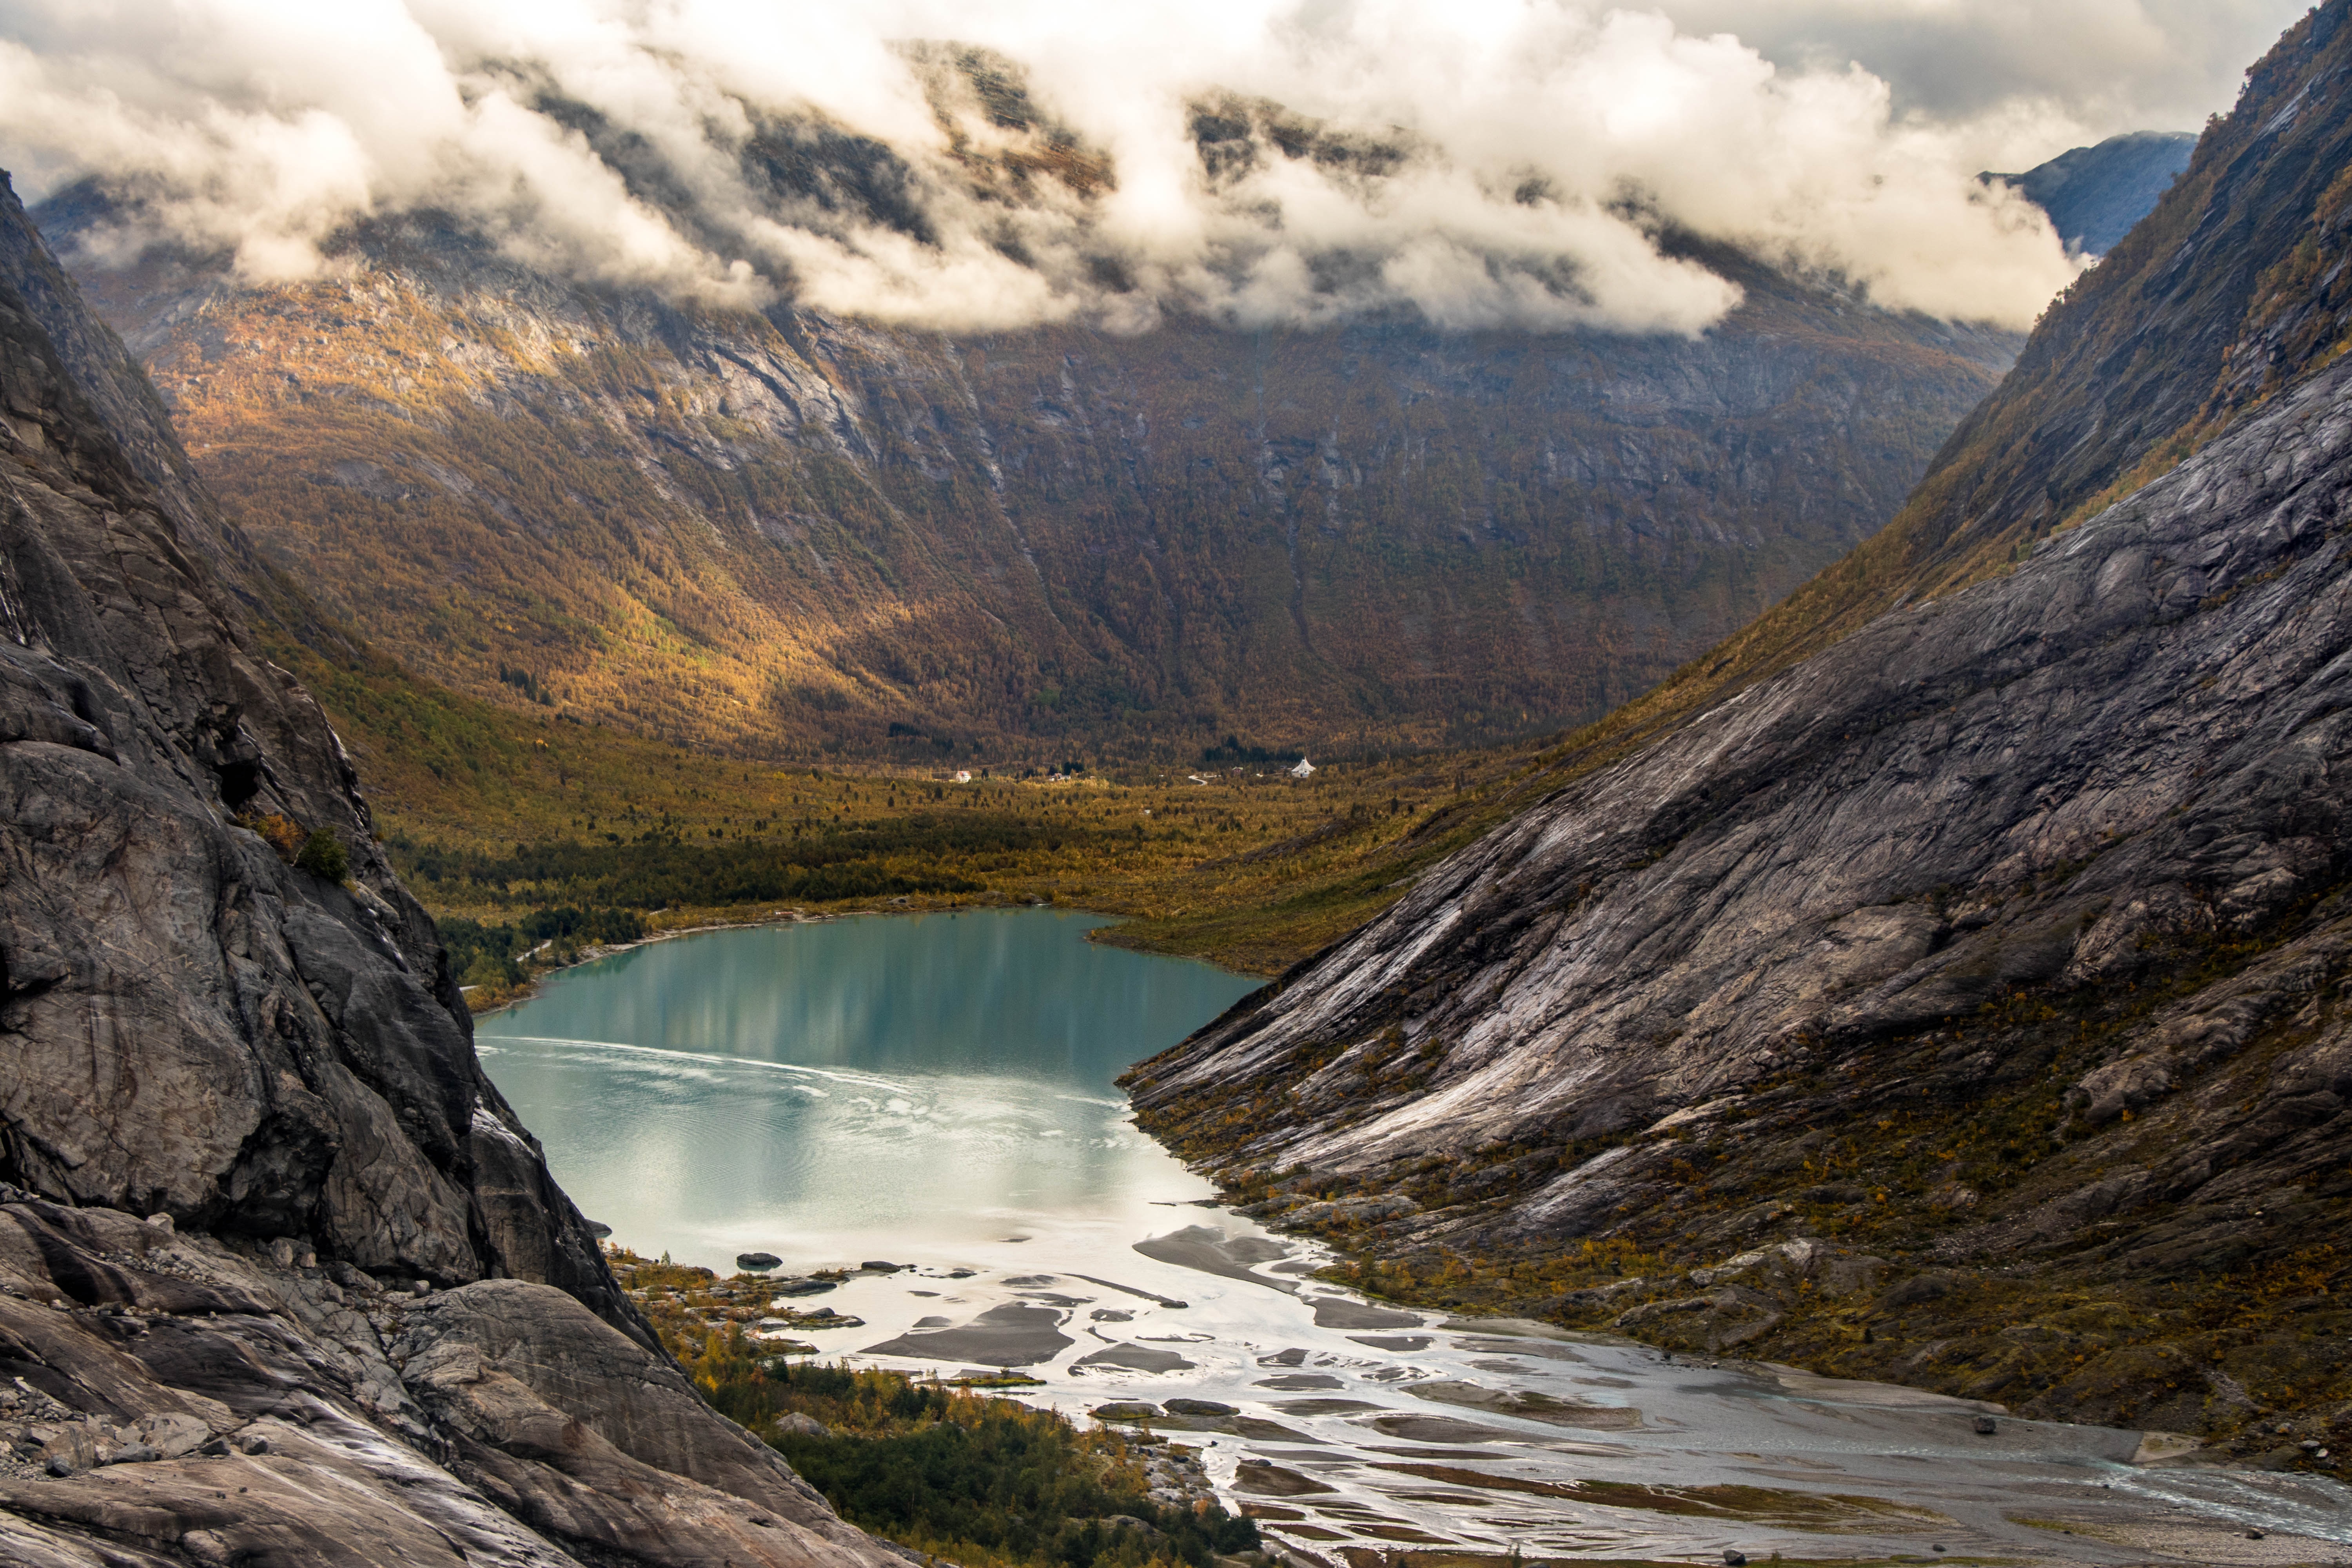
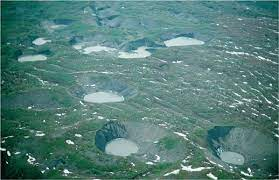
Pingos
Pingos are ice-cored hills in periglacial areas. Whilst they look the same and can be easily identified, there are two ways in which they form. They take several hundred years to form and only grow by a few cm/year. Large pingos visible in Canada and Greenland may be 600m wide and 50m tall.
During warmer climatic periods, the ice lens can melt, collapsing the dome of land above and leave a depression, typically a marshy area called an ognip, which is surrounded by “ramparts” of soil. Collapsed pingos in Wales are evidence for prior glacials and may only be 10m in diameter.
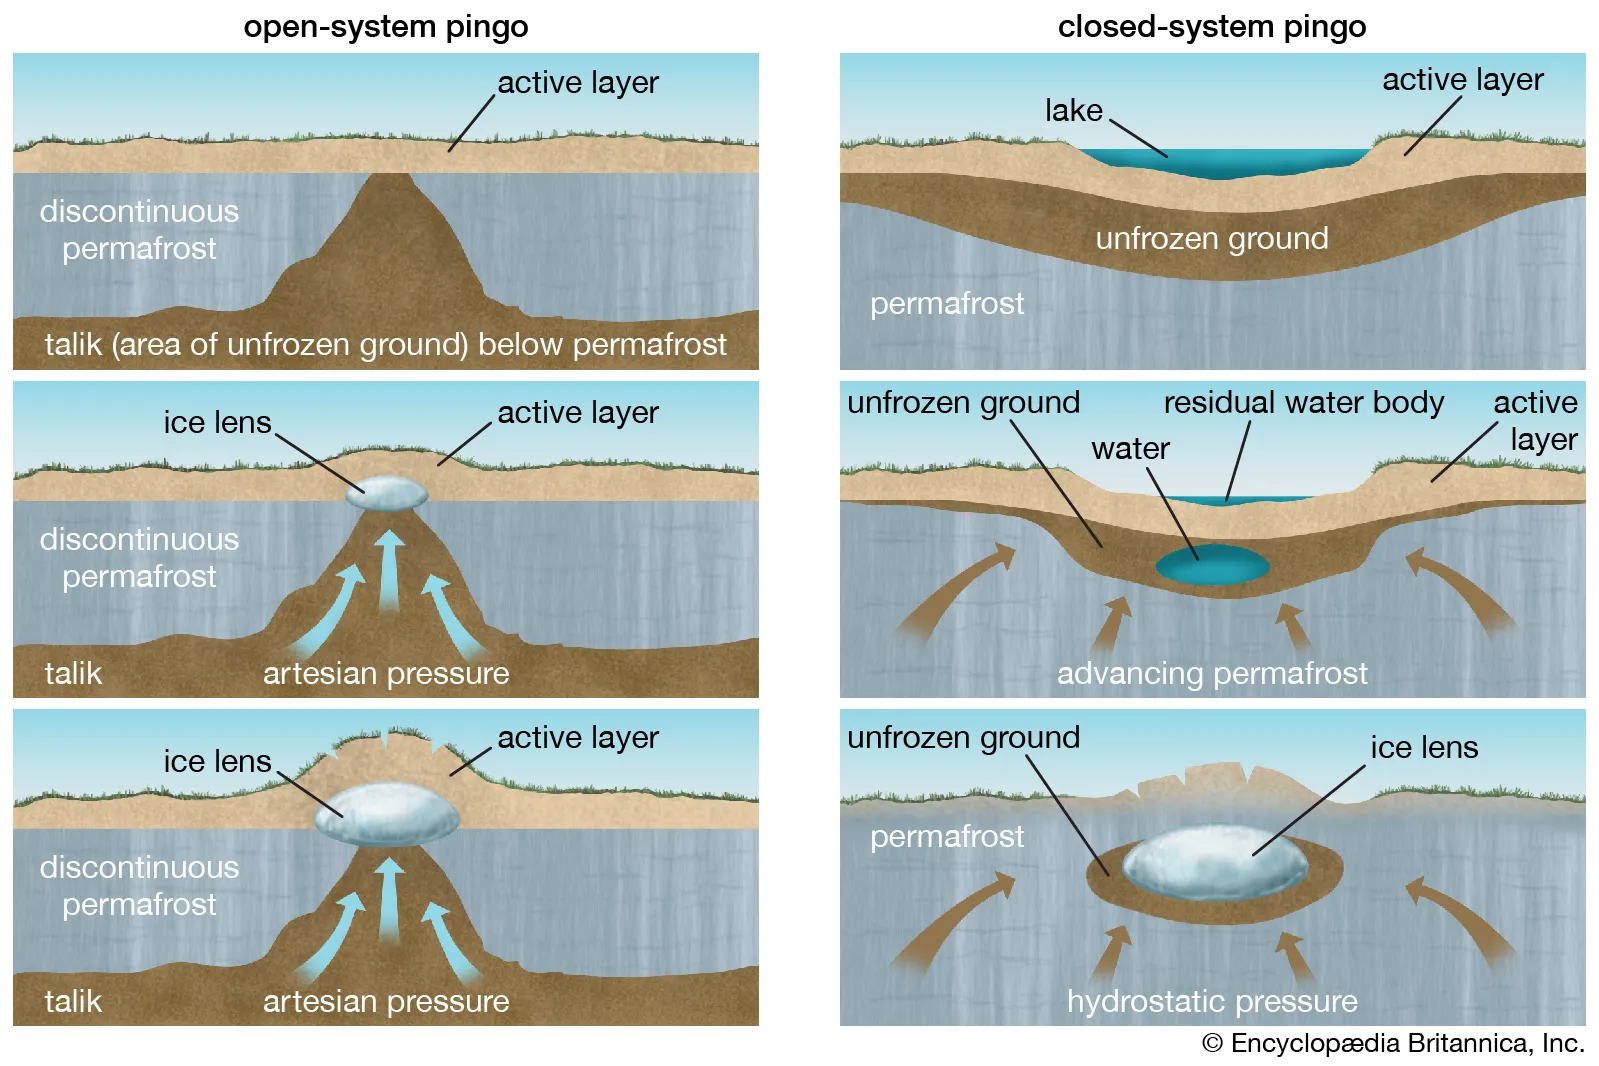
Open system, hydraulic
These are also known as East Greenland-type pingos as they commonly occur there.
Open system pingos form in areas of discontinuous permafrost, such as floors of valleys. Groundwater moves through the permeable talik and, through artesian pressure, moves upwards and cools. It feeds the ice core between the active layer and permafrost above, resulting in the ice core growing in size. Over time, the active layer above is pushed up, creating a dome of land visible on the surface.
Closed system, hydrostatic
These are also known as MacKensie-type pingos.
Closed system pingos are formed in areas of continuous permafrost. They develop in flat areas below lakes. The talik (typically fine soil, sediment or sand) below the lake is saturated by the lake, and remains as talik due to the lake’s relative warmth. Over time, the lake may become infilled with organic matter or sediment (or the water drains), reducing its insulating effect.
The permafrost thus is able to advance, surrounding the area of saturated soil, even trapping it by advancing between the saturated area and lake. Gradually the permafrost continues to advance, putting the water under hydrostatic pressure and making it rise upwards where it meets the cooler permafrost. This forms the ice core, and the hydrostatic pressure continuously feeds the ice, pushing the land above upwards into the familar pingo shape.
Ice-wedge polygons
Soil cracks when cooled quickly, just like how mud cracks when dried.
In summer, this crack in the soil fills with meltwater. Over time as many freeze-thaw cycles occur, the ice is expanded by 9% each time. This eventually results in the formation of an ice wedge. Each time the water is refrozen into ice, pressure against the surrounding soil increases, causing it to be pushed upwards, contributing to the development of these polygonal features.
Summary: Soil cracks when cooled quickly. In summer the crack fills with meltwater, and as it refreezes many freeze-thaw events take place, expanding the ice by 9% each time. This eventually results in the formation of an ice wedge.
Human activities in Glacial and Periglacial Landscape Systems
4.a. Human activity causes change within periglacial landscape systems.
4.b. Human activity causes change within glaciated landscape systems.
Case study: Oil extraction in Alaska (Periglacial)
Part of Alaska is located within the Arctic Circle, at 66.5oN.
However, since 1968, vast amounts of oil reserves have been found offshore and within Alaska itself, including inside the ANWR (Arctic National Wildlife Refuge) and, more specifically, Area 1002 within it. An estimated 12 billion barrels of oil is located in this area alone, with half of it (~6bn) being available to extract using currently available techniques.
For the United States, this would provide a key resource for energy security, while at the same time reducing dependence on foreign, potentially malicious, entities, which may limit their supply, such as Russia. This weakness has been seen in Europe, with Russia’s invasion of Ukraine, so now more than ever the US sees this as essential.
It imported 37% of its total oil consumption in 2016 (7,259,000 barrels per day).
Hydrological processes
Gravel extraction adds insult to injury. The loss of gravel from fluvial systems can change the composition of the river profile and exacerbate damages further downstream from the extraction site. Extracting gravel from a glacial outwash site has been proven to lower the groundwater levels by over a metre in a 2km radius as well.
Urban heat island effect
Barrow, Alaska is the northernmost settlement in the USA and the largest native community in the Arctic, with a population of 4600 in 2000, increasing from just 300 in 1900. Recent decades have seen an increase in mean annual and winter air temperature, with an earlier snowmelt in the village and a weaker snowmelt trend in the surrounding tundra.
The urban heat island (UHI) effect is a phenomenon where urban areas are significantly warmer than their rural surroundings due to activities by humans, like air conditioning, hot water pipes and road building.
A strong urban heat island (UHI) was found during winter, with the urban area averaging 2.2 °C warmer than the hinterland. There was a strong positive correlation between monthly UHI magnitude and natural gas production/use, ultimately resulting in a 9% reduction in accumulated freezing degree days in the urban area.
This excess heat is mostly generated from:
- The burning of fossil fuels during flaring. This increases the carbon dioxide concentration in the local atmosphere, resulting in an enhanced greenhouse effect. This increases the amount of terrestrial radiation within these areas.
- The absorption of solar radiation by urban surfaces - solar insulation warms up these more than surroundings as tarmac/gravel structures are black, which absorb more radiation.
- The reduced evaporative cooling from vegetation.
As a result of this input imbalance, permafrost can thaw, leading to changes in the landscape and the release of trapped carbon dioxide and methane, which can further contribute to climatic changes in these areas locally, as well as internationally, as permafrost contains 1.5 trillion metric tons of carbon (that’s 1,500 petagrams if you’re fancy like that - or double than what’s in the atmosphere today).
This thawing can furthermore lead to infrastructure damage, as roads and buildings can be damaged by the shifting of the ground due to solifluction.
Thermokarst
A landscape characterised by depressions due to the thawing of the ground ice which comprises the active layer and permafrost below. Visible in the Alaskan North Slope.
Case study: Kárahnúkar HEP Dam, Iceland
This dam (or, collection of three dams) was built in East Iceland on a large proglacial lake, sourced from one of the largest glaciers in Europe. It is actively retreating, so provides water to the dam which can then be used as hydroelectricity. The dam itself was finished in 2007 and is large enough to be seen from space.
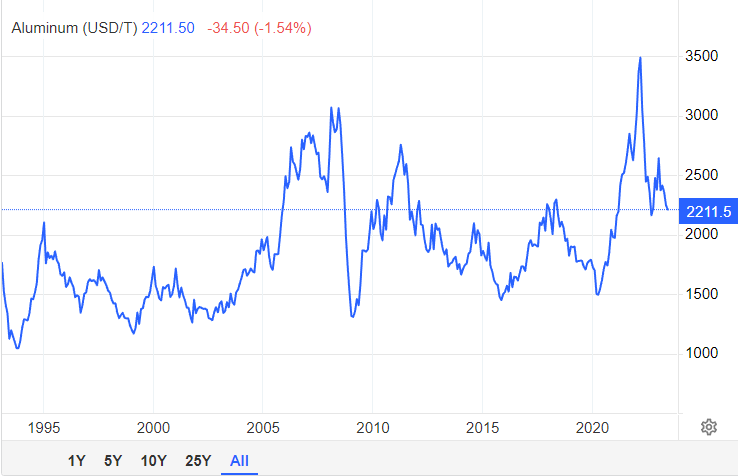
The dam could provide enough energy for all Icelandic homes and small businesses, but instead, all energy provides the nearby aluminium smelter called Alcoa.
However, there has been widespread backlash over the project, as it flooded over 400,000 acres of unspoilt highland wilderness which was the second largest unspoiled area in Europe. In total, almost 750,000 acres of land was affected by the construction of the dam, which is around 3% of Iceland’s total land mass.
The dam was built as Alcoa produces 2% of the world’s aluminium supply, and global financial markets at the time of construction were expected to make a significant number of jobs, and this aluminium industry was expected to make up 10% of Iceland’s total GDP. This has not happened yet, and the price of aluminium had almost halved just two years after construction finished, and has not recovered to this level seldom for market bubbles seen with the Russian invasion, which stressed productions of almost all raw materials.
Glacial meltwater, or glacial milk, is released by the Vatnajökull glacier and flows into the lake blocked by the dam. This glacial meltwater is known to have a high concentration of sediment within it, and as such reduces the capacity of the dam over time. This is because the suspended sediment at the base of the water solidifies when deposited, as there is little kinetic energy at the bottom to keep suspended sediment floating. Over time, the base level of the lake increases, reducing overall water capacity, until this excess sediment is ‘purged’ by the dam management system, which may happen annually.
Here’s a video of sediment getting purged
That’s the end for glaciation! I hope you found it useful.
What if I told you about Paraglaciation and Paraperiglaciation as well?
1.2 - Earth’s Life Support Systems
Section wordcount: 8796

giving earth life support - created with dall-e 3
“Without water and carbon I literally would not be here” - a wise man, 2024
1. How important are water and carbon to life on Earth?
The short answer to this is that the water and carbon cycles are very important.
The long answer? Well…:
Introduction to water
1a. Water and carbon support life on Earth and move between the land, oceans and atmosphere.
Water is a fundamental prerequisite for life, not just on Earth but it is considered by scientists as an essential necessity for any sort of life in the universe.
The Circumstellar Habitable Zone, or Goldilocks zone, is the habitable area around a star that is neither too close nor too far so that conditions for life are too hot or too cold, and categorised by allowing liquid water to be present. Otherwise, the water would be evaporated or be as solid ice. As such, liquid water allows life to form. Depending on the star, this zone can be further or closer to it, or the zone itself being wider or smaller.
It is described by astronomers as:
“The area around a stellar object which contains liquid water, making it habitable. The regulation of temperature and radiation facilitate respiration and photosynthesis”.
Water is essential to supporting life. The atmosphere is sustained by a continual cycle of evaporation and condensation through cloud formation. Water vapour itself is a very potent greenhouse gas, which regulates and moderates global temperatures: the climate is 15 degrees C warmer with water than without. As sun rays collide with the molecules in water vapour, they heat them up, causing them to vibrate and let off heat. In addition, water vapour is excellent as stopping short-wave radiation from causing harm for the biosphere. The greenhouse effect by water vapour prevents some long-wave radiation reflected from the Earth from exiting. It makes up 65-95% of all the biospheric mass, including in people, flora and fauna.
Water itself is in a closed system, meaning that water cannot enter or leave the Earth. As the water cannot exit or enter, it is transferred, stored and moved around inside the system. This is known as the global hydrological cycle.An open system within the overall closed water cycle system may be a drainage basin: water can enter and exit at any time.
| Store | Size | % of total |
|---|---|---|
| Ocean | 1.33b km3 | 96.5% |
| Cryosphere | 24m km3 | 1.76% |
| Aquifers | 23m km3 | 1.69% |
| Lakes | 176k km3 | 0.013% |
| Pedosphere | 17k km3 | 0.0012% |
| Atmosphere | 13k km3 | 0.00093% |
| Rivers | 2.1k km3 | 0.00015% |
| Biosphere | 1.1k km3 | 0.000081% |
- Data updated to match latest scientific research.
Introduction to carbon

Carbon is the building block of life on Earth. It is available for use in the natural world and by humans.
It is found across the planet, in a wide variety of stores, and is measured in Petagrams of Carbon - PgC - which is the same 1 gigaton. It is stored as a gas in the atmosphere, in oceanic sediments, and is used in living organisms to… continue living, amongst other things. Carbon is also very useful as we can use it to power various electricity generators through hydrocarbons like oil.
Similarly to water, carbon is a closed system on Earth, but on a more local scale such as a rainforest it becomes an open system.
| Store | Amount | Format |
|---|---|---|
| Lithosphere | 100,000+ PgC | Fossil fuels, sedimentary rocks |
| Hydrosphere (deep) | 40,000 PgC | Mostly CaCO3 from dead shelled organisms and bicarbonate ions. |
| Pedosphere | 2,000 PgC | Litter from dead or decaying matter and near-surface soils |
| Cryosphere | 1,700 PgC | Permafrost |
| Hydrosphere (upper) | 1,000 PgC | Dissolved CO2 from atmospheric dissolution |
| Biosphere | 650 PgC | Living organisms, flora and fauna. |
| Atmosphere | 800 PgC | Carbon dioxide |
The data is somewhat variable and differs between scientific research.
Inputs, outputs and processes of water
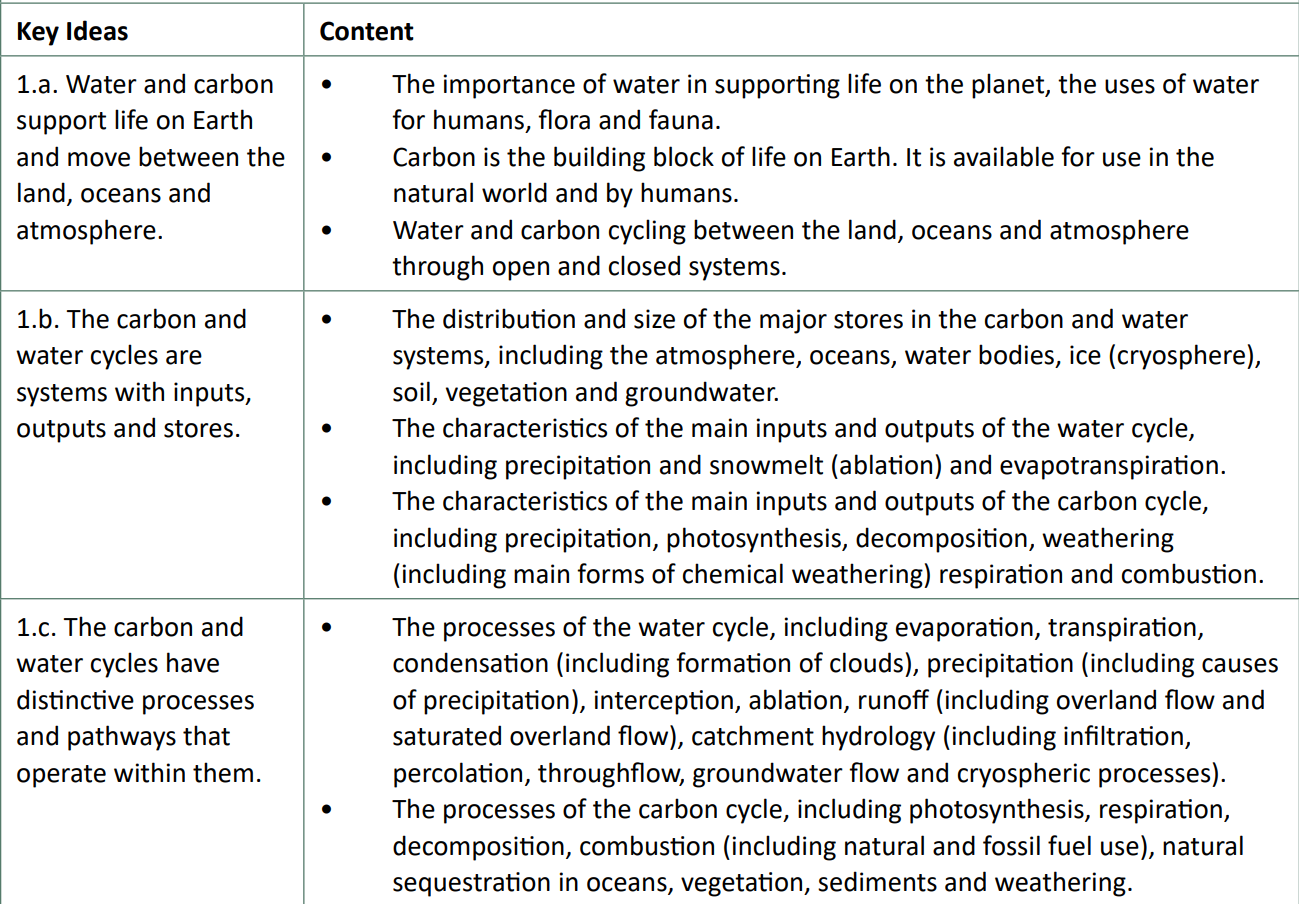
1b. The carbon and water cycles are systems with inputs, outputs and stores.
1c. The carbon and water cycles have distinctive processes and pathways that operate within them.
In the global hydrological cycle, there are many interrelated processes, stores, inputs and outputs, similar to that of a glaciated system. Flux is a term used to measure the rate of flow between stores, through mass over unit time (e.g. 3m/s). In total, around 505,000km2 of water is moved annually around this system.
Evapotranspiration
Evapotranspiration is the term used to denote the transfer of water into the atmosphere, combining evaporation and transpiration. Energy, such as insolation, when added to a mass of water like an ocean, increases particles’ energy and breaks the bonds between them, allowing for a state change to gas as water vapour, which then rises. This is evaporation. Transpiration on the other hand occurs only from the biosphere and mainly plants - this accompanies the process of respiration and photosynthesis. Leaves and plant surfaces lose water through their stomata via evaporation, and this water is replenished through effectively pulling more water and nutrients from the roots through the plant. On a local scale this may be insignificant but on a wider, perhaps national scale such as the Amazon Rainforest, the amount of water transpired through the plant, and evaporated by rivers and other stores, contribute significantly to changing global weather patterns. In total, transpiration accounts for around 10% of atmospheric water vapour.
Water in the soil (pedosphere) is the most likely to be absorbed by trees and vegetation, which transpire and release water into the atmosphere. You can use this as an example of a rapid flux, from the pedosphere, to the biosphere and then into the atmosphere, perhaps in under a day. An oak tree can transpire over 150,000 litres of water per year. In total 10% of water vapour present is transpired by plants (biosphere)!1
Precipitation
One of the main processes in the water cycle is precipitation. Simply put, this is when water leaves the atmosphere through any form, such as rain, snow, sleet or hail. When water vapour reaches the critical dew point (temperature at which air becomes saturated with moisture), it condenses in the atmosphere as clouds. Provided that there exists condensation nuclei, then clouds will form. As these nuclei of ice crystals or water droplets aggregate, they become too heavy to be suspended in the atmosphere, thus reaching a critical size and then fall to the surface as precipitation. This process is known as the collision-coalescence theory.
Water produced by precipitation is then collected in a drainage basin and moves into rivers through runoff - a combination of processes including overland flow, in addition to soil infiltration, ground percolation and subsequent throughflow and groundwater flow. Most of this water will then enter the ocean again, ready for the cycle to repeat, or percolate further into permeable rocks and be part of an underground aquifer.
Some key points:
- Where precipitation occurs at high altitudes or in cold environments, snow is likely to form, and potentially remain on the ground for a long time, increasing the lag time visible on flood hydrographs.
- Duration is the length of time a period of precipitation lasts. Climatic depressions or frontal weather systems may cause this; there may also be high rates of overland flow with flooding for long durations.
- Intensity is how much precipitation falls over a given time period. This can also have an impact on reducing lag times with high intensity, causing more overland flow due to less time to infiltrate into the soil. The amount the soil can absorb is the infiltration capacity.
- Precipitation may also vary seasonally, with greater intensity in certain months. This variation can increase or decrease the amount of water in rivers and lakes.
Precipitation may make it to the ground in a catchment area and be subject to the processes involved in catchment hydrology. Or, it may be intercepted by trees and vegetation,
Ablation
Ablation, which you might know from the Glaciated Landscapes unit, is the result of snowmelt. Glaciated environments and ice sheets contain the second highest amount of stored water on the planet - behind that of oceans - at 29 million cubic kilometres. Although most is in polar glaciers which take a longer time to melt due to the much colder temperatures, water is still released through meltwater, calving and sublimation. And from retreating alpine glaciers.
In addition, permafrost melting can also contribute to the creation of extra ponds and lakes, visible in thermokarst landscapes in the Arctic Tundra. This change occurs seasonally.
This video is a great example of the risks to humans when there is too much ablation. [VIDEO]
Condensation & cloud formation
There are some fundamental principles of cloud formation you need to know:
- HOT AIR CAN HOLD MORE MOISTURE THAN COLD AIR. (Greater energy allows for more gases)
- As air rises, it always cools, at a rate of 0.65 degrees C per 100m or so.
- Due to gravity, there are fewer molecules of air above the original air pocket. Therefore the pressure is lower, and the air pocket expands. With this expansion there is greater room for the molecules to collide, reducing kinetic energy. A reduction in energy lowers temperatures.
- Air rises when it moves over a mountainous region, or wind from below moves over a mountain.
- The atmosphere has less pressure with altitude. Therefore, the same amount of air in a ‘parcel’ will occupy a greater area at higher altitudes.
- The dew point is the critical temperature at which air can contain purely water vapour at a given pressure. Beyond this point, cooling results in condensation as no more moisture can be held as vapour.
Air moves in ‘parcels’ which have their own temperatures, humidity, etc.
Adiabatic expansion
When air cools or expands adiabatically, this means that there is no heat exchange with the environment. The parcel of air purely changes based on the pressure being exerted on it by the atmosphere.
- The environmental lapse rate (ELR) is the decrease in air temperature with altitude for a specific time and place. this is 6.5 degrees C per km on average
- The dry adiabatic lapse rate (DALR) is the rate at which unsaturated air cools during ascent, or warms during descent. The DALR is 10 degrees C per km.
- The saturated adiabatic lapse rate (SALR) is the rate at which air at its dew point (and therefore condensing) cools as it rises. Condensation releases latent heat, making this lower than the DALR at around 7 degrees C per km.
These are significant as the determine how “stable” the atmosphere is.
When the sun warms an area of land, it creates heat, which warms up the air around it. As this air is unsaturated, it will decrease in temperature at the DALR. As it continues to increase in altitude, the temperature reaches the dew point, and the air becomes saturated.1
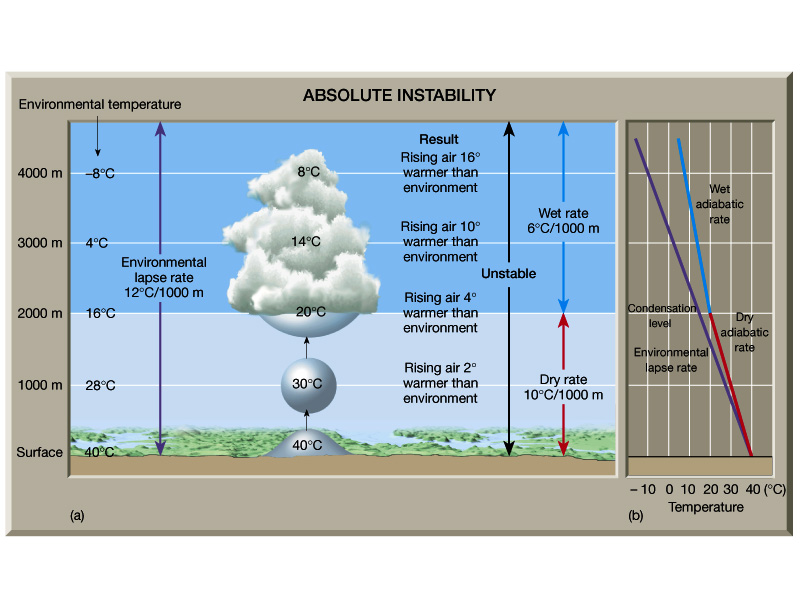
Cloud formation
Clouds main form through convection. As an area of ground warms, the local air “parcel” rises - this is atmospheric instability. For this example, let’s say that the dew point is 10degrees C lower than the temperature at the surface (as a result of insolation). Therefore, as the air has not reached its dew point, it moves upwards at the DALR, and reach the dew point at an altitude of 1km. Once it reaches this level, condensation will occur, forming a cloud. However, there is still convection occurring, as the air parcel is still warmer than the surrounding ELR. Eventually, the ELR and SALR will be in equilibrium at a given altitude, which marks the point of atmospheric stability and halt of cloud formation
Different areas at different times have different dew points. and rates of ELR
This may be hard to visualise as we cannot see individual clouds and water rising and falling. I like to resolve this by remembering that it’s not one cloud that forms: it’s a whole cloud system that can span 1000s of kilometres; the sun can cause this convection after heating whole continental areas of land.
If the dry environmental lapse rate is lower than the ELR, the air parcel that would typically rise is unable to do so as it is cooler than the surroundings and can only rise through force (e.g. topographic changes) as the atmospheric conditions here are stable.
Ways clouds form
Air can be cooled, aside from just moving vertically upwards, in several ways, and they create different types of clouds.
- Hot air rises through convection, cooling through adiabatic expansion, in areas of atmospheric instability. This forms large, puffy cumulus and cumulonimbus clouds - rain and thunderstorms common.
- Air can move laterally over a cooler area, as advection. This includes nimbostratus clouds. (Remember, as they move into a cooler area, condensation is more likely, with higher dew points)
- Air can be forced through wind over an area of high topography (mountains) through orographic lift, cooling more rapidly and thus reaching the dew point more quickly, forming clouds on the windward side of the mountain. This creates orographic rainfall on one side and a rain shadow on the other.
- When a warmer air mass mixes with a cooler one, the cooler one is heavier and will slide below the warm one. This is frontal lift. The hot air above is lifted by the cool air below, rapidly cooling it and, if this is enough to reach the dew point, the air becomes saturated and clouds form!
Catchment hydrology
There are a range of processes in a drainage basin that affect the water cycle.
When precipitation occurs in an area above freezing point, is is able to move rapidly as water as opposed to slowly as snow. When this water lands on soil, it has a few options, ultimately with the goal of moving into rivers through runoff - a combination of processes, as defined below:
Overland flow is the term used for the flow of water over the ground. It is the same as surface runoff. When on the surface, water may infiltrate into the soil - provided that the ground is not saturated. If the ground is saturated, typically defined by the water table being at the surface, then the water running off on the surface is known as saturated overland flow.
When this water has infiltrated into the soil, it can move through it laterally through throughflow. Gravity still acts on it, and therefore it may percolate into permeable ground rocks, or aquifers. Water in these rocks are stored as groundwater, and move through groundwater flow. It may then move into a store such as ocean or lake, where it remains for long periods of time. Eventually, evaporation moves it into the atmospheric store.
Inputs, outputs and processes of carbon
Precipitation
I’m not sure why the specification specifically states this, as this is mostly to do with the water cycle. However, rainwater and other forms of precipitation can combine with gaseous carbon (CO2) to form carbonic acid, which is able to break down some sedimentary rocks in situ, such as limestone. In addition, in oceans, calcium carbonate is a store of carbon in plankton and shelled organisms, and this may precipitate when the organisms die and lithify on the ocean floor. However, as carbon is acidic, too much of this can disturb marine life.
Photosynthesis
Photosynthesis is the process that transfers atmospheric carbon dioxide into the biosphere, accounting for 120 PgC per year. Plant stomata open and close and allow carbon to enter, combine with water, to create energy (glucose) for the plant, allowing it to grow and increase its transfer of carbon further. The respiration flux accounts for 118 PgC to be transferred back into the atmosphere from the biosphere store too. This is an example of the fast carbon cycle.
Decomposition
Decomposers such as fungi and microbes break down dead organic matter, and in the process releasing most of the stored carbon into the atmosphere as carbon dioxide, and some into the soil too. This process occurs very quickly in environments where there is a lot of energy usually given by heat along the equator in tropical rainforests and is slower in much colder locations like the tundra.
Weathering
Weathering includes physical, chemical and biological components, and refers to the in-situ breakdown of rock.
Physical weathering is the action of other factors such as water or biotic life mechanically breaking down rocks, for example roots cracking open rocks or freeze-thaw action.
Chemical weathering can also be significant, such as carbonation, which occurs when carbonic acid is produced (see above) which breaks down carbonates in rock strata, which then releases CO2 gas or dissolved in water streams. This contributes to how phytoplankton and other cretaceous aquatic organisms obtain their carbon - and accounts for 300 million tonnes annually.
A combination of physical weathering, which increases the surface area susceptible to chemical weathering, and chemical weathering itself
Combustion
Combustion is simply the process of burning organic material with oxygen, releasing carbon and other gases.
The biggest example of this (10 GtC/yr) is human activities, from fossil fuels for power stations. This moves carbon from the lithosphere to the atmosphere.
In natural environments too this is essential lightning creating fires, removing forest floor litter and allowing new growth when spaces of the forest canopy are opened. This moves carbon from the biosphere, and sometimes soils and peat too, to the atmosphere.
Volcanism (Hazards)
Not part of the Paper 1, but a synoptic link can be made to volcanoes and how they release carbon for Paper 3, Hazardous Earth. As tectonic activity moves carbon that has been lithified on the ocean floor as sediment into the Earth’s crust and mantle, where the matter is heated and turned into a gas. At a convergent boundary, the gases bubble up and release the stored carbon from the lithosphere into the atmosphere. This is extremely slow, known as the deep water cycle, over millions of years, but when it does occur, can be significant. This accounts for around 300 m tonnes per year (40x less than anthropomorphic emissions). Source
Oceanic sequestration
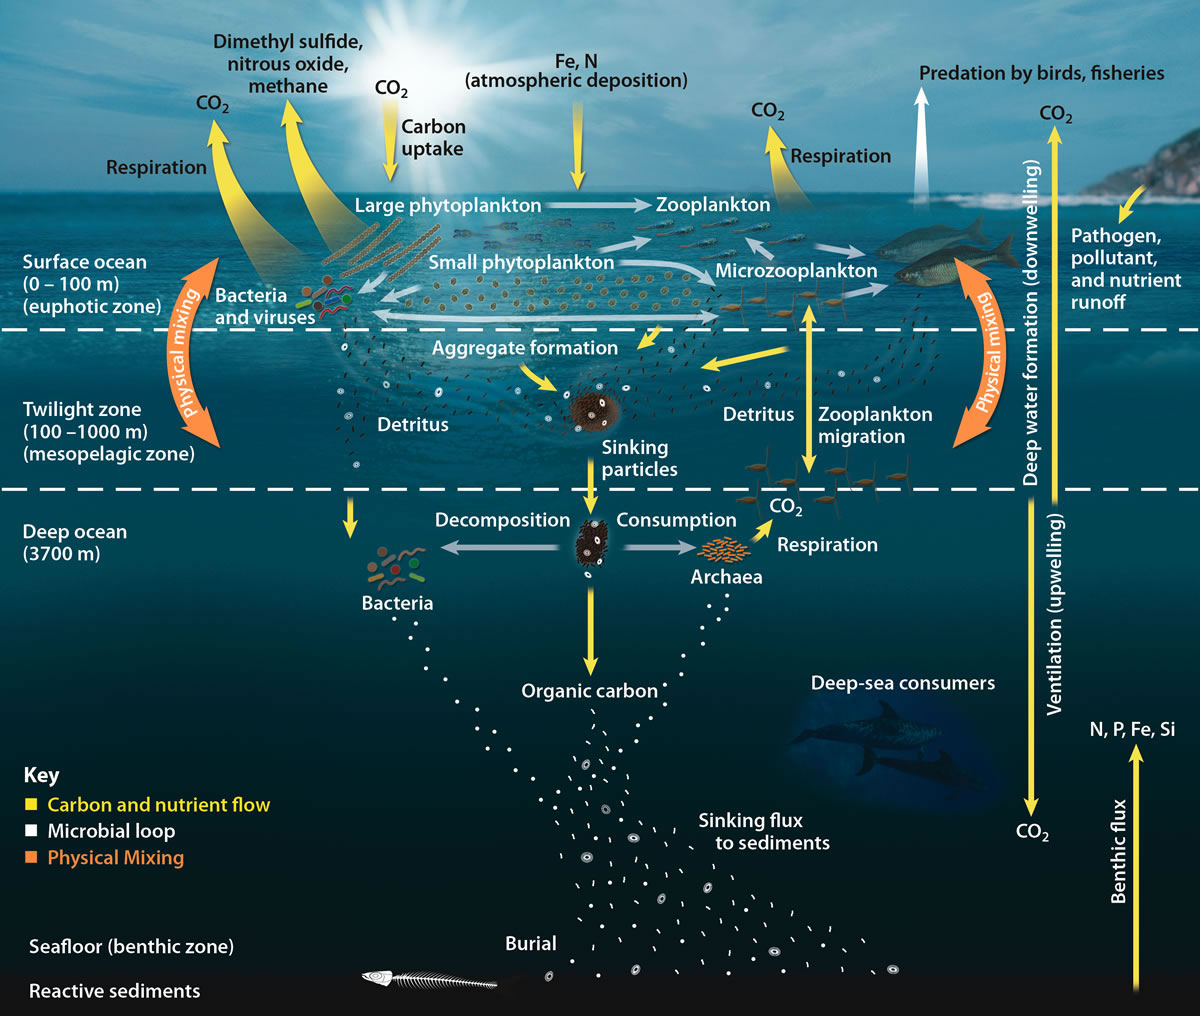
Oceans absorb large amounts of atmospheric CO2 through diffusion - there is a concentration gradient between the water and air. Currents move this carbon and the water too. In cool climates, water becomes denser, and it sinks - bringing the dissolved carbon within it too. This is an example of downwelling. As this is a cycle, upwelling may occur many thousands of years later in warmer climates.
In addition to this, phytoplankton and other marine life take in carbon from the atmosphere. This accounts for half of all photosynthesis worldwide, at over 50 GtC/yr! Phytoplankton are the basis for the marine food chain, with the locked carbon either falling into sediment on the ocean floor, or being eaten by other organisms like shelly crustaceans that then decompose (releasing CO2 gas) or, again, falling and eventually lithifying into sedimentary rock, being part of the long-term carbon cycle.
Vegetation
Vegetation, or the biosphere, takes in huge amounts of carbon and sequesters it for long periods of time. Rainforests, boreal forests and mangroves photosynthesise large quantities of carbon from the atmosphere. In general, for the first 100 years of a tree’s life, it is a carbon sink, and even after this period ends, the carbon sequestered is visible in its huge trunk and biomass store, potentially several tonnes of it. Some vegetation can store carbon for centuries.
Sediments
Sedimentary rocks include limestone, shale and sandstone. As sediment, from organic matter, builds up over time, the sediment at the base of an accumulation may be compressed and turned into rock, a process known as lithification. This process notably occurs at the ocean floor and accounts for 0.2GtC/yr from the hydrosphere -> lithosphere.
Case study: the Amazon Rainforest
2a. It is possible to identify the physical and human factors that affect the water and carbon cycles in a tropical rainforest.
You may have done this at GCSE - might be good looking back for a more general understanding!
Topical rainforests are almost exclusively located between the two tropics, at 23.5degN and S from the equator. They are categorised by:
- having high average temperatures (around 27degC)
- little variation in temperatures seasonally
- very high annual precipitation (>2000mm). Although the precipitation can vary seasonally, with Manaus recording 6x more rainfall in winter/spring compared to summer, there is no dry season.
- Net primary productivity (the net gain of carbon stored in an ecosystem) is about 2,500g/m3/yr.
Undisturbed tropical rainforests absorb over 30 tonnes of C/ha/yr, and respire 24.5t C/ha/yr. The amount of total carbon stored in all rainforests is around 100 GtC, with 1-3GtC annually absorbed from the atmosphere.
- There are ~390 billion trees in the Amazon. (around the same number of stars in our Milky Way galaxy)
70% of the Amazon is located in Brazil.
Physical factors affecting water
Water has many stores and flows in the rainforest. Water is affected by a variety of physical factors including:
- temperatures
- rock permeability and porosity
- relief
High temperatures allow the atmosphere to have high absolute and relative humidity, with a higher dew point. This allows large, cumulonimbus clouds to form with convectional rainfall from the heat, all year round. Diurnal changes in temperatures mean that precipitation occurs typically in the afternoons.
In addition, these high temperatures and the geographical location (between the tropics) mean that transpiration losses are high, but also the inputs into the plants are high, stimulating great plant growth, which in turn increase water uptake and evapotranspiration. Overall, 1/2 to 3/4 all precipitation is recycled (evaporated without any runoff), demonstrating strong interdependence between the land, biosphere and atmosphere with evapotranspiration and precipitation.
This is an example of a positive feedback loop: greater vegetation, greater evapotranspiration, greater precipitation, greater vegetation… etc.
Rock permeability in the Amazon is also a physical factor. The Amazon Basin is surrounded to the north and south by the Guiana and Brazil Shields, sections of ancient crystalline rock with high amounts of jointing, with the central Amazon River lying in between, in an area of weakness. This means that runoff rates are much higher for large portions of the Amazon, due to there being little potential to store and slow water movement during intense precipitation events, with short lag times. In the west, outcrops of limestone and other porous rocks can help to store water and reduce overland flows. In the long-term, huge water stores have built up in the underground aquifers and the soil, with a shallow water table of under 5m.
Relief also plays a role. The gentle relief of the basin today results in most flows being horizontal, either overland or throughflow in the soil. However, the Andes to the west increases the relief significantly. Higher relief adds energy to water and thus there is less chance for infiltration to occur. Surface runoff is much higher and, combined with orographic lift likely occurring here, there is the potential for low-lying flood plains downstream to fill for several months. Therefore, relief can both increase and decrease levels of overland flows, whilst altering the stores of water in the soil or over the land.
Physical factors affecting carbon.
Carbon stores and flows are influenced by temperature, vegetation, organic matter in the soil, and rocks’ mineral composition.
Biomass, unexpectedly, is the greatest carbon store, with 100 billion tonnes of it. The temperature sustains strong rates of photosynthesis, which creates more plant matter and a positive feedback loop ensues, with NPP at 2500g/m3/yr. The amount of organic matter in the soil accounts for 40% of the rainforest’s total carbon store, showing there is significant storage and sequestration in the roots of trees. The growth is facilitated by high temperatures, which is strongly dependent on the interrelationship with the water cycle.
The high temperatures and demand for nutrients also make the store of carbon in and on soil very low, due to the very fast decomposition of dead matter by decomposers. Organic carbon thus circulates very rapidly.
The mineral composition of rocks, is largely igneous and metamorphic, with granite being abundant. These are not carboniferous but store large amounts of carbon in the long-term.
Spatial scales
An individual tree may have little influence on the cycle of water and carbon. Trees are the main factor in reducing the velocity of precipitation, shielding the soil and preventing runoff of nutrients. At the same time, detritivores and decomposers are sheltered from the sun under tree cover, allowing for rapid decomposition of nutrients and release of carbon on the forest floor. A single tree sequesters over 22kg of carbon every year from the atmosphere through photosynthesis fixation through the stomata of each leaf, permanently (well, until combustion or deforestation occurs).
An individual tree can take up around 50,000 litres of water every year from the soil. This is fuelled by uptake from the soil and groundwater stores, naturally reducing the amount of water there and adding it to the feedback loop of evapotranspiration and precipitation. They also play a part in intercepting precipitation, evapotranspiration and stabilising the soils through their roots, which are a large subterranean carbon store too.
The rainforest as a whole may create flying rivers due to the sheer amount of water being pumped by transpiration and the temperatures facilitating evapotranspiration. Huge amounts of water is transpired - 20 billion tonnes per day by the 390 billion trees acting as pumps from the soil to the atmosphere, so much so that there is more water in these flying rivers than there is in the Amazon River itself.
The Amazon rainforest stores over 100 billion tonnes of carbon and absorbs 2.4 billion tonnes annually, with 1.7 billion tonnes released through decomposition and respiration. This has a global scale impact, with it accounting for 1/4 of all terrestrial carbon absorption. Small changes in the carbon cycle thus have wide-ranging consequences.
Madeira drainage basin
This basin is located in the southeast of Amazonia and in Brazil, Peru and Bolivia. It accounts for about 20% of the Amazon’s area and is the largest tributary river. Deforestation has occurred in the higher elevation catchment areas, reducing the immediate storage of carbon and water in the biosphere and eroded soils. The outcrops of permeable rocks in this area, due to the velocity of water increasing and therefore less time for absorption, decreased in their water storage.
Downstream, flooding in 2014 caused the inundation of floodplains, and water levels at Porto Velho reached record levels at 19.68m above normal. There were 60 deaths, 68,000 evacuations and the longer-lasting effects of water-borne disease outbreaks including cholera. Unexpectedly high rainfall (exacerbated by orographic lift) combined with the reduction of interception, decreased lag times and increased the peak flow. Overland flows increased substantially, with water unable to infiltrate into the soil as much and percolate into aquifers, it was understandable that the overland flow in Porto Velho was too much, and the ground was full saturated by this point.
Impact of human activity
As already demonstrated, there is high interdependence between the land, biosphere and atmosphere. If just one of these are disturbed, there is a consequence on all the other aspects. According to REDD, between 10 and 20 per cent of global GHG emissions are caused by forest destruction and damage, which equates to more than the entire global transport sector!
70% of deforestation in the area is cattle ranching. In total, deforestation peaked at 20k km2/yr in around 2005.
The effects of deforestation are wide-ranging. Converting trees into pasture increases runoff by 27x. Rainforests also have significantly greater humidity and convectional rainfall versus pastures, decreasing the likelihood of cloud formation downwind from them. This can cause droughts and greater aridity at a national or global scale - studies have found that this moisture cycle regulates rainfall patterns in the western United States. Deforestation in one area makes other forests unexposed also more likely to be at risk through environmental degradation, potentially causing a snowballing effect of damages to not only the ecosystem but the carbon and water cycles at large.
On the carbon cycle, human activity shrinks the carbon stored in biomass by between 90 and 99% with grass or croplands versus the rainforest, from hundreds of tonnes per hectare to just two tonnes. Soils are depleted with less decomposer activity, and have nutrients, being washed away quickly with the precipitation not being slowed by throughfall or stem flow.
Deforestation also causes a degrading effect on other areas of land beyond the immediately deforested area. 38% of remaining Amazon forest already degraded - an area 10x the size of the UK and amounting to over 1 million km2; these areas exhibit similar (but somewhat less severe) characteristics to deforested regions.
All of these combined have resulted in severe droughts downstream for population centres in Rio and Sao Paulo. The lack of water in reservoirs and extreme heatwaves due to the South American climatic system no longer being in equilibrium as a result of human activity is stressing aquifers and groundwater stores further, which is unsustainable.
Management strategies
Several management strategies that preserve and have positive effects on the water and carbon cycles are in use today.
Legislature
Almost half of the Amazon today is classified as a natural park or conservation areas. Here, deforestation and farming is banned. Legislation prioritises large swathes of primary forest and ensures it does not become commercialised.
Legislation can also be legally binding, with severe consequences for those who are guilty of deforestation or entering these areas. However, continual investment in policing is required for it to be effective in the long-term.
Afforestation & Reforestation
Schemes such as REDD+ involve large TNCs exchanging carbon credits. The Surui people received payment from Natura which was used to finance the planting of trees in deforested and degraded areas.
NGOs also have a large role to play. The Parica project is in the 4th most deforested state of the Amazon, and is planting 20 million trees over 100,000 hectares of land. Although a monoculture this still plays a role in carbon sequestration and reduces surface runoff, allowing the degraded land to be restored and contribute to the rapid cycling of water and carbon again.
The UK’s FSC has sponsored projects across Amazonia and works with companies to support sustainable forestry. In 2020, this accounted for 220,000 hectares and has also accounted for over 350,000 tonnes of CO2 sequestered annually.
Improved agricultural techniques
Deforestation for cattle ranching and growing crops such as soya is unsustainable. The soil is not very fertile - nitrogen, potassium and phosphorous are absorbed quickly by the large rainforest trees. After deforestation this is considerably reduced - rates seldom reach 100 cows per square km (that’s 1 million square metres). This encourages practices like “slash and burn” when areas of rainforest are just cleared and moved on to the next areas when the soil is no longer profitable, after only a few years.
Crop rotation and the integration of animals alongside crops may help increase fertility. Animals excrete the necessary substances for plant growth, which allows for 5x increase in land potential in already deforested areas.
“Dark soils” are also being scientifically engineered that can support high densities of permanent arable and animal farming. This may eliminate the need for deforestation into new areas, and return the water and carbon cycles to their former equilibrium glory if successfully created.
Case study: the Arctic Tundra
2b. It is possible to identify the physical and human factors that affect the water and carbon cycles in an Arctic tundra area.
The Arctic Tundra is located between 60 and 75 degrees N and includes parts of Russia, Canada, Norway, Iceland and Alaska, among others. It occupies a combines 8m km2 and is defined by having a July isotherm of 10 degrees C. This means that t warmest month reaches a maximum temperature of 10 degrees (this is roughly equivalent to the tree line). The Arctic Circle is the southernmost point where the sun can remain below the horizon for 24 hours during certain seasons.
The tundra is in a negative heat balance for 8-9 months of the year, releasing more heat than it takes in. This is a combination of polar cells in the atmosphere, and the Earth’s tilt meaning that areas remain below the horizon, thus being in complete darkness for 2 months of the year. During these times, temperatures may reach -40degC. The inverse is true in the summer, where the long daylight hours somewhat compensate for the short growing season.
Physical factors of water
The mean annual temperature is -15C, with precipitation between 50 and 350mm, with a mean of around 100mm annually - of which most is snow.
The little energy due to poor insolation for most of the year means that there is low absolute humidity. The freezing conditions mean there is low ground and soil moisture, with little rates of evaporation. As a result, there is limited groundwater and soil moisture stores, with permafrost below stopping percolation and subsequent groundwater flow.
Seasonal changes in summer occur, with a few months of a positive heat balance. Insolation melts the snow on the surface and the active layer thaws, creating surficial stores with lakes and ponds, whilst permafrost stops any further infiltration. Evaporation is somewhat heightened here too, but still extremely slow. Overland flow in rivers may be high, with the Yukon river reaching 24,600 cumecs in summer compared to 340 cumecs in the winter.
Rocks remain largely impermeable, due to both the permafrost and solid water and the igneous geology with various interlocking crystals, reducing porosity. The relief is largely flat too, encouraging the waterlogging and pooling of water on the surface.
Carbon cycle
Permafrost is estimated to contain 1,600 GtC in the tundra. The main store of carbon is in the soil and permafrost: low temperatures mean little decompositional activity, and it may take thousands of years for plants to decompose. The biomass store is very little due to the extreme temperatures.
In the long-term, the degradation of permafrost and
Oil Extraction
Oil was developed in the 1970s due to domestic demand and lesser reliance on other countries for the USA.
Oil is most optimally extracted at 80 degrees C. In tundra areas, this creates a significant heat imbalance and gradient between the thousands of kilometres of pipes that transport this oil and the vulnerable permafrost below.
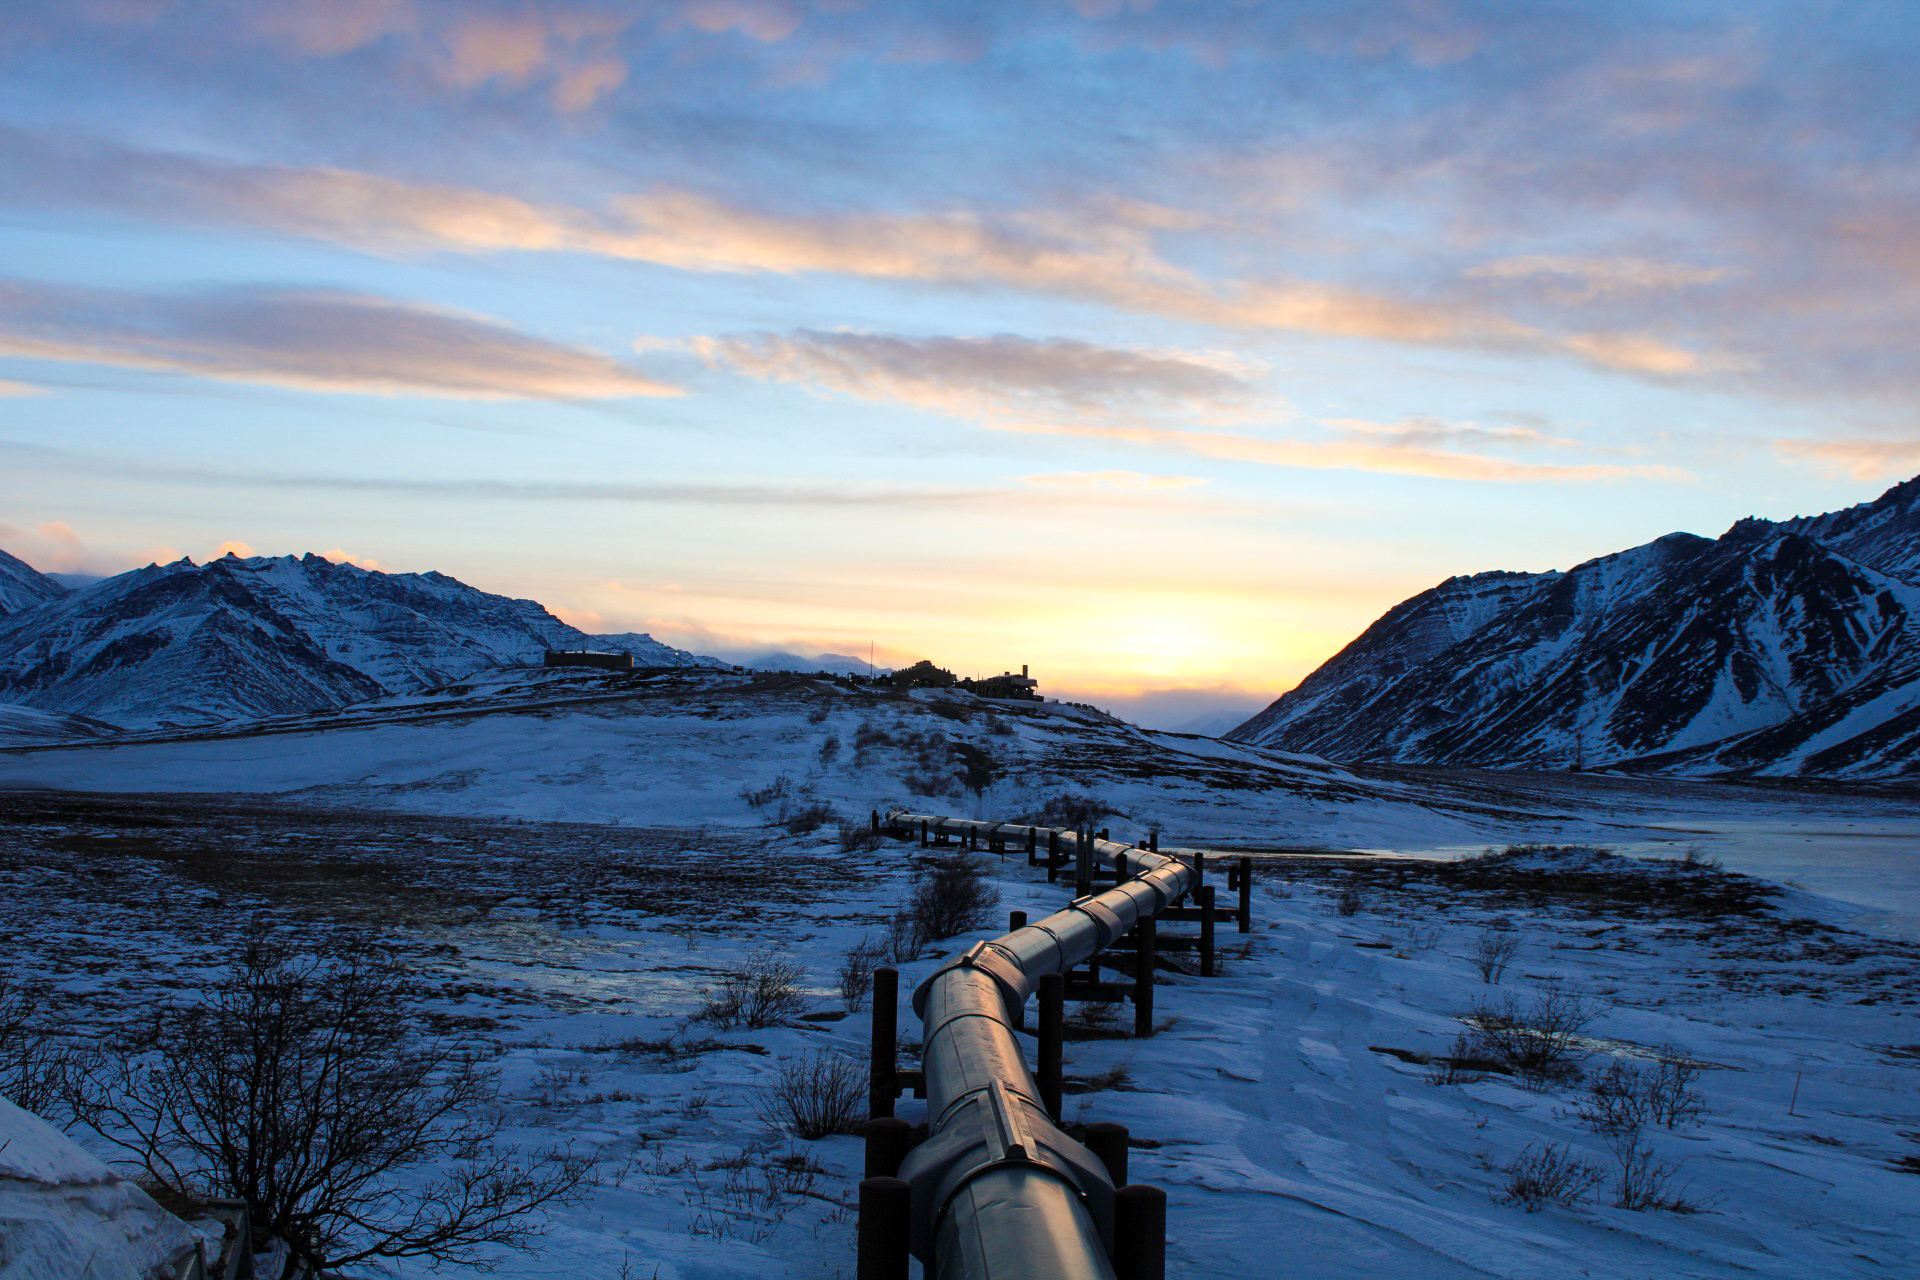
Management strategies in the tundra
- snake drilling: from one site, lateral drilling underground can reach more areas. This reduces the need for there to be infrastructure and heat pipes between oil extraction sites, which can melt permafrost and remove vegetation
- building on pads and piles: gravel pads absorb large amounts of heat, effectively replacing and complementing the active layer, reducing the heat the permafrost is exposed to. Spine Road, Prudhoe: 2m tall gravel pad.
- Piles are like stilts: infrastructure can be built on them, meaning that they are not in contact with the ground, using the air as a buffer between warm buildings and the permafrost.
- refrigerated supports: directly cools the ground below the infrastructure and the Alyeska pipeline, stopping the absorption of heat by the earth through direct cooling and creating a gap between the infrastructure and the ground
- supercomputers and AI: remote sensing and computation with the cloud and AI reduce the need for infrastructure to be built in areas to explore: predictions can be made accurately from afar.
Changes over time
3.a. Human factors can disturb and enhance the natural processes and stores in the water and carbon cycles.
3.b. The pathways and processes which control the cycling of water and carbon vary over time.
Equilibrium and Feedback Loops
The global carbon and hydrological cycles are typically in a state of dynamic equilibrium - a balance between all stores and flows in a system. This means that if there is an imbalance of one aspect of the system, such as the inputs, then processes and outputs will adjust to ensure that the system remains stable. In the long-term, this may be true. In the short term, the inputs, outputs and flows may sway from net gain to net loss, or vice versa, in disequilibrium. Negative feedback loops are examples of the system self-regulating. Positive feedback loops are the opposite.
Positive feedback loops
Positive feedback loops are a snowball effect. That is, the system, after a trigger occurs or threshold is reached, the system increasingly becomes out of balance.
In the water cycle:
- A greater greenhouse effect increases global temperatures. This means the atmosphere can hold more moisture. The higher temperatures increase evaporation rates. This increases the greenhouse effect. This means that temperatures are higher, and evaporation increases.
- Temperature increases in atm. This increases sea surface temperatures. This melts polar sea ice. This decreases the albedo effect from snow&ice cover. This increases sea surface temperatures…
In the carbon cycle:
- A greater greenhouse effect increases temps. Permafrost in the tundra is able to melt more quicky. CO2 and CH4 are released. This increses temperatures
Negative feedback loops
In the water cycle:
- Higher temperatures from greenhouse effect. This increases evaporation. With more atmospheric water, more clouds are likely to form. This increases the albedo effect, reducing the amount of sunlight that is reflected as long-wave radiaion. This lowers temperaturs and evaporation.
- A rainfall event may occur. This increases the amount of infiltration and percolation into groundwater stores. The water table rises with more water. This increases overland flow, until the water level lowers. This lowers the amount of water in aquifers.
In the water cycle:
- Increased atm CO2 emissions. This increases the amount of CO2 in the atmosphere. The CO2 available to plants increases, causing carbon fertilisation. Plants thus absorb more carbon from the atm. This lowers the atm CO2 concentration.
Land use changes
A range of land use changes act as a catalyst for altering the flows and stores in the carbon and water cycles.
Urban growth
Urbanisation (change in land use from rural to urban). This:
-
replaces natural land with impermeable surfaces, such as tarmac;
-
reduce percolation and subsequent infiltration, increasing runoff;
-
encourage fast drainage of water after precipitation into sewage systems;
-
ultimately, decreasing the lag time and increasing peak flows.
-
decreases natural stores and sequestering of carbon, even releasing it from trees that may be burned;
-
requires additional surrounding land to sustain development, reducing diversity and carbon stores;
-
increases carbon emissions on a local scale from urban development and combustion.
Farming
Modern agricultural techniques require huge amounts of change to natural environments and huge amounts of water to sustain crop growth. In the Colorado River basin, USA, agriculture accounts for 80% of all water that is used.
- irrigation systems are typically located closest to rivers; reducing river flow and storage in aquifers
- irrigation increases water in the soil (pedosphere) temporarily, with an increase in evaporation and transpiration increasing relative humidity;
- aquifers may dry up, decreasing the local water table, lowering the number of springs, and flow in rivers.(could you link this to a negative feedback loop?);
- natural interception is reduced vs forest or grasslands;
- ploughing increases evaporation losses and decreases soil moisture;
- ditches and subsurface draining channel water rapidly away from being able to infiltrate and percolate, and into streams or gulleys, increasing peak flow;
- heavy machinery compacts areas of soil that inhibit infiltration on a local-scale
Forestry
Modifes the water cycle on a local scale, depending on the type of trees and area of effect.
Water Extraction
Water extraction includes surface extraction and also extraction of water from aquifers and artesian basins - thus the removal from these stores and transfer to others.
Artesian aquifers are those under artesian pressure. This means that in a syncline area - one confined by strata of impermeable rock geologies - water is able to travel to the surface, depending on the potentiometric surface. Imagine that the water table in an area of porous chalk is at the surface. However, the chalk in this basin - a U-shape with various layers of rock above and below - is at the base of this “U”. When drills are made into the bottom of this basin which may be above a population centre such as London, this water is able to rise to the surface, as a hole has been put into the impermeable rock.
In London, the water table fell by 90m due to industry. By 1990 it was recovering at 3m/yr. Underground infrastructure was threatened and Thames Water now has permits to abstract water, maintaining the equilibrium.
In the River Kennet, upstream from London, which drains 1,200 km2 of land, water extraction from sources has decreased river flow by 14% consistently. This is worse in droughts when up to 40% of the flow is lost. This reduces overland flow in the river, and also the flux as percolation into aquifers, whose water tables are less likely to rise to the surface, affecting a number of springs and saturated overland flow and water in surrounding areas. Water available for uptake by trees is also lost. Downstrem, floodplains have seen a lowering in the water table and less time spent with the saturated ground.
How water and carbon are linked
4.a. The two cycles are linked and interdependent.
As I’ve hinted at and I’m sure you’ve realised by now, the water and carbon cycles are linked in many ways.
- Oceans
- Atmosphere
- Cryosphere
- Vegetation
Management strategies for carbon
At a local scale, an example of an all-round approach to management strategies can be seen with the UN’s REDD+ scheme - which offers incentives to companies and businesses to change the way forest resources are handled. “Carbon credits” can be purchased by TNCs from local tribespeople, who use the money for sustainable development with agroforestry and land stewardship, as opposed to more intensive agriculture, reducing emissions and deforestation. UNEP - REDD
Afforestation
Afforestation is the process of planting trees in areas where there are none, perhaps as a result of prior deforestation, or simply where trees do not traditionally grow. Trees need to have a permanence of 100 years to be an effective sink; they take up carbon in this period in the medium to long term. Over time, trees can absorb large quantities of C02 from the atmospheric store - around 1 tonne per tree.
The Chinese Great Green Wall and the one in Africa with the same name are examples of large-scale afforestation projects. An estimated 100 billion trees is being targeted to be planted by 2050 over a land area the size of Spain in the Gobi Desert, sequestering carbon (you can do the maths here) and also reducing desertification and land degradation - China’s biggest biological threat. The broader implications of afforestation may be a good idea to place in essay conclusions for 16-markers.
Of course, ensuring that the land does not become deforested in the first place, perhaps though legislation or policing against farmers and miners can be argued to be a more effective management strategy as this preserves the natural ecosystem. Or, legal but managed logging of areas that ensure that monocultures are avoided whilst preserving the biodiversity through the replanting of diverse trees may also be a better strategy.
Agricultural practices
Agricultural practices are also used in conjunction with afforestation, especially in areas previously subject to unsustainable practices or “slash and burn” techniques. Livestock farming, mostly cows, accounts for around 75% of deforestation in the Amazon, and emits over 100 million tonnes of methane, which is 28x more potent than just CO2, on top of the release of sequestered carbon in forest regions cleared for agriculture.
At a local scale, Degraded Land Afforestation in Uruguay uses “carbon financing” (carbon credits), which may come from REDD+, to plant trees on more degraded land, whilst cattle graze in the lower areas.
Indirect measures can also be taken: animal feed can be improved, such as by giving seaweed to cows reducing methane burp emissions by 82%. Manure can also be recycled or added to anaerobic containers can also be a way to generate energy in rural areas, reducing the reliance on fossil fuels.
Restoration of wetlands
Globally, wetlands account for around 7% of the land. But also 35% of the terrestrial carbon store - meaning that they are very effective carbon sinks. Compared to tropical rainforests, they can store up to 50x more carbon in the same area. Globally, peatlands store 2x more carbon than all forests.
The conditions of wetlands create low-oxygen soils, leading to anaerobic conditions. This inhibits the decomposition process and matter is thus unable to be broken down, accumulating as peat over time.
However, where these regions are widespread such as the tropics, human activity to sustain high population densities has reduced the amount of natural mangroves and salt marshes. Despite this reduction and associated risk to natural ecosystems, there have been schemes and actions taken to restore the prevalence of these wetlands. In Cambridgeshire, 500ha of low-lying land has been converted back to wetland as a result of the EU Habitats Directive. Controlled flooding of inland areas such as the Fens can also contribute to reclaiming land by the sea in these areas where the water table is naturally much higher.
In Canada, which is home to 25% of the world’s wetlands, 70% of the wetlands have been lost. However, pledges have been made to restore 30 percent of the degraded land by 2030 and over 1000 sq km has been restored, sequestering almost 400,000 tonnes of C per year!
Carbon capture and storage
CCS is a technique used to stop carbon emissions from the source, such as in factories or power stations, or through directly capturing it from the air. Carbon dioxide may be captured and compressed, transported into a pipeline, and used in offshore oil extraction where otherwise it may be uneconomical to do so. Or, it could just be pumped into a syncline basin with impermeable rock where it remains hopefully for a long time.
International carbon agreements
The most effective way to protect the global carbon cycle may be international agreements. These provide a legal framework for large-scale, mass carbon emissions reductions globally, when done correctly.
1997 Kyoto Protocol
The Kyoto Protocol was the first major climate change protocol. Whilst it was legally binding, and 192 parties were included in it, many developing nations such as India and China - who “needed” to emit to continue their growth, were exempt from the protocol, and even some ACs such as the USA and Australia did not ratify the treaty. The overall goal of the protocol was to limit emissions to 5% of 1990 levels - and it worked. The protocol also had multiple rounds, the second of which capping emissions 18% below 1990 levels to 2020.
Kyoto introduced three major mechanisms to help reduce carbon (and the emission of other gases).
- Emissions trading: commoditises greenhouse gas emissions. Article 17 sets out the amount of greenhouse gas emissions that each country is permitted to emit, based on the overall target of the protocol (5% above 1997). Countries are allowed to buy and sell quotas of carbon - but due to supply and demand, prices of investing in sustainable development in the long term are cheaper. More details in the cap and trade section below.
- Clean development mechanism: This incentivises industrialised countries to invest in cleaner energy use in countries in the process of developing. This gives ACs flexibility on how quotas are reached - as the offset of carbon is counted as their emissions - whilst encouraging the use of these sustainable practices - such as the use of solar panels in rural communities - in developing nations. By 2012, this accounted for around 3 billion tonnes of CO2 reduction.
2015 Paris Climate Convention
The PCC in 2015 attempted to build on the successes of the Kyoto Protocol whilst also modernising it. It aims to limit CO2 emissions and temperature increase below 2 degrees C.
- Countries publish their naturally determined contributions and there is pressure at the global scale to consistently outperform other countries;
- Long-term strategies
Management strategies for water
There are global strategies that have the potential to protect the water cycle, including:
- forestry
- water allocations
- drainage basin planning
Forestry techniques
The protection of forests ensures that areas on a local scale are protected from deforestation in law. The UN, World Bank and governments all collaborate to ensure forests do not become degraded. The REDD+ programme funds projects in over 50 countries with direct investment, technology and carbon offsets.
NGOs such as WWF and the ARPA program in Brazil ensure that over 128 million acres of land, targeting 150 million, are protected.
Water allocations
In areas of water scarcity, water may be allocated by governments and rationed between different groups and stakeholders, such as businesses, farmers and individuals.
Agriculture, as seen in the Colorado River basin in the USA, accounts for over 80% of the water use. Globally agriculture accounts for over 90% of consumption, including municipal and industry sectors.
Management strategies
- minimising water loss through evaporation with the use of drip irrigation, reducing usage by 70%.
- terracing and vegetative strips encourage the pooling of water on the surface. This reduces runoff and allows more time for water to infiltrate, moving through the soil as throughflow.
- capping usage for certain states (in the Colorado basin) to ensure that droughts do not disproportionally damage downstream states and environments.
Drainage basin planning
This is a collaborative effort at the drainage basin scale to encourage the sharing of demands and needs for everyone involved, including domestic use, industry and agriculture.
Calculations are made in relation to the amount and rates of fluxes in the system, with “targets” placed on stores. For example, stating that aquifers should always remain 50% at capacity with a high water table. After these plans have been made, actions can be taken, such as reforestation to improve interception rates, slowing peak flow, and encouraging greater infiltration and percolation. Urban areas can be financially incentivised to reduce the amount of impermeable surfaces - such as in the EU Water Directive Framework pre-2020 where 10 catchment hydrologies had holistic plans established to improve the amount and availability of water at this scale.
Additional Skills
The OCR specification also lists some specific skills you must have to ensure you get full marks. These topic-specific skills are:
- climate graphs
- simple mass balance (remember from glaciation?)
- rates of flow
- unit conversions
- analysis and presentation of field data
Statistical tests
Median
Rank the data and work out the middle value. If it’s between two points, then take the mean value between them.
- easy to calculate
- not affected by extreme, anomolous values
- most of the values are ignored
- less “sensitive” than the mean (a significant change on one side can be balanced by a small number on the other)
Mean
Add all values in the series together and divide by the total number of values. This is the “average”.
- all values accounted for
- gives fair representation for all values
- affected by all values even if anomolous/very large or small.
Mode
The value that occurs in data the most.
- can be used on qualitative data
- useful for spotting patterns
- may be multiple modes, or none at all
- only useful for specific enquires
Range
Subtract the lowest from the highest value in the data.
- shows the full spectrum of all data
- can be significantly affected by extreme values
- most data is ignored
Interquartile range
Rank the data, then identify the median. For all values below the overall median, calculate the median. Repeat for the upper half. Then, subtract the lower half median from the upper half median.
- measures dispersion of data
- not easily affected by outliers
- doesn’t include all values
Spearman’s Rank
Tests the significance of a correlation between two variables.
Compare the number of items (degrees of freedom) given to the significance table. The hypothesis can be rejected if the number in the table is below the critical value at 0.95, then your hypothesis can be rejected. If it’s above, then there is less than a 5% that the relationship was caused by chance, and you accept the hypothesis. You can go even further if given a critical value of 0.99, whch means there is a less than 1% chance of this being caused by chance!
If you have a t-value, then subtract 2 from the degrees of freedom. Else, leave it as the number of samples.
Confidence intervals can be obtained from the following formula:
(no need to know this - unless you do maths?)
Kyoto introduced three major mechanisms to help reduce carbon (and the emission of other gases).
- Emissions trading: commoditises greenhouse gas emissions. Article 17 sets out the amount of greenhouse gas emissions that each country is permitted to emit, based on the overall target of the protocol (5% above 1997). Countries are allowed to buy and sell quotas of carbon - but due to supply and demand, prices of investing in sustainable development in the long term are cheaper. More details in the cap and trade section below.
- Clean development mechanism: This incentivises industrialised countries to invest in cleaner energy use in countries in the process of developing. This gives ACs flexibility on how quotas are reached - as the offset of carbon is counted as their emissions - whilst encouraging the use of these sustainable practices - such as the use of solar panels in rural communities - in developing nations. By 2012, this accounted for around 3 billion tonnes of CO2 reduction.
2015 Paris Climate Convention
The PCC in 2015 attempted to build on the successes of the Kyoto Protocol whilst also modernising it. It aims to limit CO2 emissions and temperature increase below 2 degrees C.
- Countries publish their naturally determined contributions and there is pressure at the global scale to consistently outperform other countries;
- Long-term strategies
Management strategies for water
There are global strategies that have the potential to protect the water cycle, including:
- forestry
- water allocations
- drainage basin planning
Forestry techniques
The protection of forests ensures that areas on a local scale are protected from deforestation in law. The UN, World Bank and governments all collaborate to ensure forests do not become degraded. The REDD+ programme funds projects in over 50 countries with direct investment, technology and carbon offsets.
NGOs such as WWF and the ARPA program in Brazil ensure that over 128 million acres of land, targeting 150 million, are protected.
Water allocations
In areas of water scarcity, water may be allocated by governments and rationed between different groups and stakeholders, such as businesses, farmers and individuals.
Agriculture, as seen in the Colorado River basin in the USA, accounts for over 80% of the water use. Globally agriculture accounts for over 90% of consumption, including municipal and industry sectors.
Management strategies
- minimising water loss through evaporation with the use of drip irrigation, reducing usage by 70%.
- terracing and vegetative strips encourage the pooling of water on the surface. This reduces runoff and allows more time for water to infiltrate, moving through the soil as throughflow.
- capping usage for certain states (in the Colorado basin) to ensure that droughts do not disproportionally damage downstream states and environments.
Drainage basin planning
This is a collaborative effort at the drainage basin scale to encourage the sharing of demands and needs for everyone involved, including domestic use, industry and agriculture.
Calculations are made in relation to the amount and rates of fluxes in the system, with “targets” placed on stores. For example, stating that aquifers should always remain 50% at capacity with a high water table. After these plans have been made, actions can be taken, such as reforestation to improve interception rates, slowing peak flow, and encouraging greater infiltration and percolation. Urban areas can be financially incentivised to reduce the amount of impermeable surfaces - such as in the EU Water Directive Framework pre-2020 where 10 catchment hydrologies had holistic plans established to improve the amount and availability of water at this scale.
Statistical tests
Median
Rank the data and work out the middle value. If it’s between two points, then take the mean value between them.
- easy to calculate
- not affected by extreme, anomolous values
- most of the values are ignored
- less “sensitive” than the mean (a significant change on one side can be balanced by a small number on the other)
Mean
Add all values in the series together and divide by the total number of values. This is the “average”.
- all values accounted for
- gives fair representation for all values
- affected by all values even if anomolous/very large or small.
Mode
The value that occurs in data the most.
- can be used on qualitative data
- useful for spotting patterns
- may be multiple modes, or none at all
- only useful for specific enquires
Range
Subtract the lowest from the highest value in the data.
- shows the full spectrum of all data
- can be significantly affected by extreme values
- most data is ignored
Interquartile range
Rank the data, then identify the median. For all values below the overall median, calculate the median. Repeat for the upper half. Then, subtract the lower half median from the upper half median.
- measures dispersion of data
- not easily affected by outliers
- doesn’t include all values
Spearman’s Rank
Tests the significance of a correlation between two variables.
Compare the number of items (degrees of freedom) given to the significance table. The hypothesis can be rejected if the number in the table is below the critical value at 0.95, then your hypothesis can be rejected. If it’s above, then there is less than a 5% that the relationship was caused by chance, and you accept the hypothesis. You can go even further if given a critical value of 0.99, whch means there is a less than 1% chance of this being caused by chance!
If you have a t-value, then subtract 2 from the degrees of freedom. Else, leave it as the number of samples.
Confidence intervals can be obtained from the following formula:
(no need to know this - unless you do maths?)
Paper 2
2.2.2 Global Systems – Migration
Page 30 in the OCR A Level Geography H481 Specification or search for: ‘Global Systems: Option B – Global Migration’
Definitions
A migrant, according to the UN definition, is someone living outside their country of origin for at least a year.
Interdependence - is the interrelationships between ACs, EDCs and LIDCs through trade, foreign aid and migration
Globalisation - is the growing integration and interdependence between peoples’’ lives economically, politically and environmentally.
Economic migrants are those who migrate just for monetary gain, and no other reasons. They may send money back. They may also bring dependents.
Contemporary patterns of migration
Monetary remittances include money sent from economic migrants back to their home country and their family. This is significant for a variety of reasons; firstly, the stability of incomes in LIDCs, which are typically where large numbers of economic migrants emigrate from are improved. In addition, money increasingly is worth more for LIDCs - seen in Haiti where 37% of its GDP is from migrants sending home money.
Migration is significant, and worldwide! In 2020, 291 million people were living outside their country of origin. Furthermore, of these, 73% were economic migrants, showing just how key money is to fuelling global flows of people and ideas.
Global migration involves dynamic flows of people between countries, regions and continents.
Intra-regional migration
Intraregional migration is migration that occurs within a region, for example, the European Union.
The Poles are coming!!
Prior to Brexit, there was a large bilateral corridor between the UK and Poland; this is categorised as being intra-regional as this was in the EU.
The accession of Poland, and other A8 eastern European countries in 2004 allowed significant amounts of migration due to the freedom of Schengen movement. Many moved westwards, attracted by both higher wages and higher demand for low-skilled labour.
There is some evidence that the bottom 10% of the pay scale in the UK has had wage growth suppressed by EU immigration. However, the overall relative wage growth is 49% since 1992 and the top 50% of employees have seen the opposite effect: that EU immigation has increased natives’ wage growth, and for the top 10% it has grown by 35%.
Migrants fom the new EU joiners are more likely to be in employment. As of 2019 over 83% of these new immigrants had almost a 10% lead compared to natives and other pre-2004 EU members. Conformatively to global migratory trends, this is because it is the youthful population who migrate, incentivised and able to work in more conditions, without an economically “burdensome” family or dependents.
According to the Financial Times, there is no evidence that European migrants come to live a life on benefits or take jobs from Britons. The average European migrant who arrived in 2016 will make a total lifetime contribution to the UK public finances of £78,000 - more so than any UK native, or non-EEA migrant.
Inter-regional migration
Today, the amount of south-south migration has outpaced south-north or north-north.
There is more and more inter-regional migration occurring globally, with increasing globalisation processes allowing for people to reach different places more quickly, cheaply and in increasing number.
A range of reasons are contributing to this growth.
- The communications revolution: more people have increasing access to communications devices such as mobile phones - increasingly being “required” in countries in the global south, and the internet and social media allow potential migrants to see and get a feel for their destination, whilst migrants already living in new destinations can create increasing links with the origin country and encourage further growth. Thanks to this, there is less of a “culture shock” and it allows people to remain connected to their home lives
- New source and destination areas. Economies such as the UAE and Gulf nations have looked to diversify and build a new economy, requiring millions of workers and
Compared to the 83% employment rates of intra-regional migration, those coming into the UK from outside the EEA only have employment rates of 68% - the lowest of all groups, natives included.
Consequences of migration
When I say “consequences”, this includes both positive and negative factors. For example, migration creates both stability whilst also may increase inequalities.
Flows of people through migration is intrinsically linked to flows of money, culture, knowledge and ideas.
Positives of migration
Broadly, the positives of migration can be split into three distinct characteristics. This includes stability, growth and investment.
Stability
Stability refers to a combination of economic, social and political stability.
In the short-term, migration allows countries of destination to receive greater income tax (the vast majority of migrants, approximately 73%, are economic migrants who pay both income tax and VAT on purchased goods). In the UK for example, this income tax equates to around £16 billion for the public purse - despite the accusations of “benefits tourism” and abuse of public services.
Whilst not a problem currently, ageing populations will be supported by migratory flows. Ageing Western populations with low domestic birth rates - such as the UK’s 1.6 - will require migrants to support the 2 working to 1 pensioner general requirement to ensure that countries do not run into significant debt and the collapse of the state. Migrants who decide to stay are very likely to build - or already have - families, thus contributing to population and tax-base growth.
Social stability, though social remittances and the diffusion of ideas inheritly promotes ideas between source and origin. For South-North migration, this is especially true for democratic, equalitarian ideas (Politics students - please correct my terminology here) whilst globally flows of people can encourage politicians to engage with peacebuilding and the resolution of conflicts.
Economic Growth
Economic growth is largely an… economic factor.
- The GDP and tax base of a country is significantly boosted by migration, especially in LIDCs and EDCs. 37% of Haiti’s GDP is from remittances.
- Migrants open up new demands for goods and products in a destination area. Tesco in the UK has launched over 100 lines of Polish food, and “oriental shops on every corner” is commonly quoted in inner UK cities due to the amount of immigrants and those of immigrant heritage.
- Multiplier effects as a result of supplementary remittance income in areas of origin is common.
NEPAL has had a multipler effect in rural infrastructure, small businesses and education. 25% of its GDP in 2014 vs 42% in 1995 was from remittances - reduction largely a result of domestic increasses
Development
- Sociopolitial development as a result of returning flows of people, skills and capital is of great benefit to countries of origin.
- Long-term development of an origin country can be facilitated by strong diaspora links that help to transfer skills, capital, knowledge and ideas through professional, social and religious networks. This has been furthered by the communications revolution.
- NGO and supranational organisations such as the UN “Migration and Development” scheme allows collaboration between countries, families, private and public organisations for a bottom-up but also large scale approach to development in a source region.
Negatives of Migration
Inequalities
Inequalities are the uneven treatment of people.
- The process of brain-drain, at least in the short-term, exacerbates and amplifies issues such as women’s rights: it is the men who emigrate from these countries and work in other countries. Furthermore, the young and well-educated, possibly from state education system, are the most likely to move - at significant cost to the state who lose their young tax base.
- Remittances can exacerbate inequalites between communites and families that receive them and those who do not, especially in LIDCs. (The theory for this is the Relative Deprivation Theory) -> families will compare themselves to others in the village/neighbourhood and, if they see themselves as less well-off, this may encourage further migration and a multipler effect of greater losses for the area of origin. This is a problem too within (advanced) countries - over the past hundred years, rural Italian towns and villages are becoming ghost towns as the youth are moving into larger towns and cities/abroad and leaving older people behind, resulting in a net decrease.
Injustices
Injustices refer to the unfair treatment of people.
- Migrants often have their human rights violated as a result of perhaps their lack of knowledge, language barrier or false promises.
- Women and children may be targeted by human traffickers to be abused or even “sold” in the “maid trade”
- Asylum seekers are often seen as burdens and many countries do their best to avoid processing of them. In Lampedusa, Italy, migrants from Tunisia and Libya are often held in prison-like conditions where MSF said that there is signifiant risk of disease outbreak. They may not be given adequate food, space or clothing.
- Migrants may be viewed as second-class citizens and prone to abuse, even in ACs, by landlords who can leverage the language barrier and possible lack of understanding to support high amounts of people in inadequate housing spaces (Peterborough)
Conflicts
- High immigrant populations concentrated in one area can put significant pressure on public services and can promote feelings of being “a foreigner in your hometown” among resident populations. For example, in Peterborough UK, Polish migration was described as an “epidemic” between 2016, and GPs had over 1000 registrants in a period of 6 months. Pressure on the education system as well - one class had 24 languages spoken with no additional support, and class sizes rose above 30.
- Natives may think that the newcomers are “stealing jobs” which is typically true, if these jobs do not want to be performed by natives in the first place, typically in primary or secondary “3D” jobs.
Case study: Brazil, an EDC
Brazil is an EDC with a GDP per capita of US $8,917. This has over doubled since the year 2000 - and is rapidly moving through the demographic transition.
Current patterns
For the last 15 years Brazil has seen a significant immigration decline, whilst emigration is increasing. In total there are over 4 million Brazillians living overseas - with 1.9 million in its largest diaspora in the USA - but despite being a “country descended from immigrants” less thn 1% of its population is foreign born. Today, there are over 100,000 fewer immigrants than there were in 2000 - but emigration has increased by almost 1 million. However, there remains strong bilateral corridors between Brazil and other Mercosur nations - of which it leads - in South America, through demand by businesses and competition in the form of cheaper labour.
Emigrants offering low-skill labour is slowing due to the rapid development of the country. However, Brazil is increasingly losing many high-skill workers to the EU, USA and Japan. The tertiary sector today accounts for 69% of Brazil’s economy - compared to the 25% of the secondary and just 6% for the primary.
Changes over time
There have been waves and flows to and out of Brazil, enriching its culture and forming the modern day society.
- Many Europeans in the 20th Century were attracted by the agriculture demand and coffee growing, furthered by prior colonial relations.
- During the 1980s and an increasing in the secondary sector textiles production attracted many South Koreans, but also illegal movement between other South American nations with cheaper labour costs.
- Demand for the 2014 Football World cup and 2016 Olympics increased international labour demand
- A steady stream of migrants from LIDC countries such as Haiti and Bolivia. Haiti saw devastating natural hazards in 2010 and 2012 with an earthquake and Hurricane Sandy.
- Yo-yo migration from the USA during the 1990s during Brazil’s instability resulted in hundreds of thousands of temporary visas being exchanged every few years - a regular, huge flow of people, money and capital.
Interdependence
The USA
The USA has high numbers of political, socioeconomic and environmental links with Brazil. The majority of Brazil’s over 4 billion in remittances come from low and high-skill labourers in the USA enticed by significantly greater wages. Development through social remittances must also not be underestimated. The Brazillian diaspora in the US is now 1.9million, with the service sector growing among well-trained Brazillians. Many of these people may choose to remain in the US, with remittances being sent back until the family can afford to reunite with the US immigrant. This corridor is so large that the US have a “special agreement” with Brazil, with agriculture, teacher training, education and defence spending.
Environmentally, USAID has a great interest in the Amazon Rainforest, and collaborates with Brazil’s FUNAI to coordinate and plan environmental projects, preserve indiginous peoples and contribute to the gathering of scientific information - important on the global scale with the increasing importance of climate change on the world agenda.
Haiti
Although the poorest country in the Western hemisphere, Brazi significantly supports peace and social integration of Haitians through the provisionment of humanitarian visas, with 54,000 after Haiti’s political instability and natural disasters. The National Immigration Council for Brazil reduces Haitians’ vulnerability to human rights abuses and have physcial presence in the country to allow visas to be given easily. Many Haitians occupy roles in the primary and secondary sectors in the large cities, filling skills shortages.
Portugal
Portugal is well-known in Brazil for being the “gateway to the EU” for economic migrants. Sharing the same language, having colonial links and a political “special status” given to Brazillians has resulted in the Portuguese being the largest diaspora community in Brazil, and on the other side the second largest diaspora community (behind the US). The social benefits of this link are great between the two countries, with flows of ideas and people aided by the communications revolution.
Impact
Economic Development
The continued waves of immigrants to Brazil has undoubtedly kickstarted its transition from LIDC to EDC to AC. The impact of the 50,000 Japanese living in Brazil today - with 2 million with Japanese heritage - is that the Japanese are hard working and reliable - something that has spread particularly into the mentality of Brazillians especially in Sao Paolo. Brazil today is a powerful member of the G20, has the 7th largest economy in the world, is the leader of the Mercosur group and is also part of the BRICS group - widely-regarded as the countries with the greatest potential for future development, incentivising further foreign investment.
Political Stability
Brazil has a stable democracy, good education system and strong civil rights. Flows of people and capital have helped to reduce border and trade friction (there is free trade within Mercosur), promote integration and have contributed to very “western” anti-discrimination laws - such as the ratification of CEDAW (which even the USA has not). Globally Brazil is known for being very open towards environmental and political refugees such as the Haitians but also from neighbouring countries including Bolivia.
Social Inequality
Despite being a “country of immigrans” it is unfortunately those who are disciminated against in society, with African immigrants consistently the lowest in terms of educational attainment and exam scores. Many migrants - and those internally moving - also end up in cities’ infamous “favelas” due to the cheap costs of living but that exacerbate social enequalities.
Case study: AC USA
The USA is an AC that influences and drives the global migration system through economic, social and political factors. It is the #1 biggest economy of $25tn with some of its companies valued greater than other entire countries.
Patterns and policies
The USA has always had a strong influence on the global migratory system, attracting large numbers of immigrants. Despite the threats of recent politicians its immigration policies are fairly liberal.
The USA had an open border system for “any free white person” could become a citizen. Many Irish and European immigrants came during the Californian Gold Rush and opportunites in the “new world”, amounting to an average of 250,000 a year between 1820 and when this policy was changed in the 1882 Immigration Act.
Currently, there are 90.8 million migrants in the USA. 5% come from India and China, many are “persons of extraordinary ability” and are high-skill (Silicon Valley) wokers or have student visas from wealthy Asian families looking to be educated.
Mexico though is by far the greatest contributor to the US migrant population with an over 28% share.
Today, there are several key policies. However the Immigation and Nationality Acts attempts to keep this number capped at 675,000 annually.
- Green Card: open-door policy that allocates 50,000 visas anually at random to anyone that applies. It is a lottery system that promotes diversity. This gives a permanent residency card
- Skills-based visas such as the H-1B, H-1A and O-1 allow 140,000 migants with skills deemed “valuable” and who are sponsored by a company every year to arrive. These are “aliens of extraordinary ability” and are highly educated, skillful, graduates and entrepreneurs who fuel innovation.
- Family reunification: 226,000 people can be sponsored annually by lawful citizens to become permanent citizens. This is at risk with Trump-era policies and is viewed as the major source of challenges, so has a significant backlog.
- Histroically amnesty has been given especially by Obama to allow illegal immigrant “dreamers” through policies such as DACA that protects children brought to the USA. This allows over a million people to have an education, work and live without fear of deportation
- Refugees and humanitarian visas: the USA has historically taken in more refugees than the entire world, combined. This number changes annually but stays at around 45,000 per annum
Key Policies
- Immigration and Nationality Act, 1965.
- Established quotas
- Laid the foundations for the reunification system and overall structure for today’s policies
- Immigration Act 1990
- Added several, well-known employment visas used today including H-1B visa
- Increased legal migration by ~40%
- Allowed families to remain “in-tact”
- Illegal Immigration Reform & Immigrant Responsibility Act 1996
- Increased spending on the border with walls and fences to $5B/yr
- Mexican immigrants became “trapped” in the US
- Overall immigration levels remained slightly unchanged
- Followed up by Secure Fence 2006 that made the border even more dangerous
and more!
Interdependence (Mexico)
The USA’s southern neighbour Mexico has over 37 million Mexicans, and each country had each other’s largest diaspora. This beings social and cultural diversity, with Spanish being the second most common language and also being “protected” under US treaty.
Mexico also provides southern states such as Texas and southern California with low-skill, frequently illegal populations driven by the higher wages (though unfortunately many are still exploited by low-paying employers) and demand for agriculture and construction in the rapidly growing southern cities. Remittances constitute 4% of Mexico’s GDP (or 63bn $US), largely from the USA.
U.S. Companies are expected to invst 40bn in Mexico throughout 2024. This creates a mutual demand for politicians to treat the interdependence between the countries seriously, with the companies benefitting from growth whilst Mexico benefits from greater availaibility of jobs and resources.
There is increasing environmental political cooperation and interdependence with Mexico through the joint management of the Colorado river basin (that supports 40m people) and increasing collaboration regarding the fighting of illegal crossings, and drug and people trafficking at the border. USAID also invest in governmental projects to reduce deforestation by 2030 and promote natural climate solutions and energy efficiency.
Opportunities
- 3/4 of Indians and over half of the Chinese immgrants are “persons of extraordinary ablity”, able to fuel innovation especially in regions such as Silicon Valley (both Microsoft and Google CEOs, Satya Nadella and Sudnar Pichai are Indian). USA benefits from cultural and social enrichment in businesses, education, arts and the sciences.
- Most immigrants are young and of working age. The largest age bracket of Indians is 30-34 and for Mexicans this is 40-44, boosting the tax base, allowing for gaps in the labour market to be filled and sustains natives’ demand to be in higher paying, tertiary sector jobs. Over 45% of Mexicans were in primary or secondary-sector jobs (just think about how many people that is!!)
- Immigrants are themselves consumers, creating businesses. There is evidence of greater diversity and the occupation of old, industrial inner cities now occupied by migrants who redevelop the area.
Challenges
- Conflict. Trump and the Republican/Democratic divide has created ideas about the negatives of the Mexcian “epidemic” and various language has been used, but not all words become actions. According to the BBC only 80 new walls have been built… out of 1,951 miles.
- There are still, despite amnesties, high amounts of unauthorised, illegal immigrants, an estimated 10.9 million, as a result of the “American dream” ideology throughout central and southern American countries using Mexico as a way in.
- The tightening of border laws, deployment of border control agents and ever increasing “bureaucracy” to process migrants has beome a deterrent - and a burden for the taxpayer.
- The size of the illegal population who do not wish to declare themselves out of fear is a barrier to social, economic and political integration. It may be burdeensome on the demand of resources in scarce regions with high migrant stock - such as southern California (a desert).
Profound Statement
Politics play on the fears of people in the west who want to protect their own culture, wealth and lifestyle without consideration for the cultural, social and economic benefits that migration has on countries and regions within.
Case study: LIDC Lao PDR
Laos is an LIDC with very limited influence over the global migratory system.
Laos has a population of 6.8 million and is a landlocked, south-east Asian country. As an LIDC it has a HDI of just 0.576 and GDP per capita of around $2,050.
72% work in subsistence agriculture, and, with 1 in 3 below the age of 15 (age of majority). There is very much an expectation that children will contribute to the family life by working in agriculture day-by-day - and young people are “lucky to get a few years’ education”. Naturally, this means that poverty rates are high, with 22% below the absolute poverty threshold.
The only solution to this for residents it to migrate. The border with Thailand is porous, with brokers in Laos and Vientiane that aid the transfer of people. The reasons for this is clear: Thailand is a rapidly growing economy with a HDI of 0.802, creating a skills shortage and gap in the job market, especially primary sectors. The minimum wage is 300 baht, vs just 80 baht in Laos, meaning people can obtain 4x more money just by moving across the Mekong River - which is well-connected with several Thailao friendship bridges (to Vientiane). This, combined with the language, culture and hetitage similarities, result in Thailand having 960,000 Laotian immigrants, Laos having a diaspora of 1.29 million overseas and a net migration rate of -1.1 per 1000 per year.
Migration policies in Laos are ineffective. Human trafficking is very common - between 200,000 and 450,000 annually in the Greater Mekong area - seen through the trafficking of underage footballers to Laos in 2015 and the border with China referred to as the “millionaire’s playground” and associated “maid trade” out of the country. The ASEAN bloc has relatively free movement of individuals and special agreements for skilled labour including dentists, tourism and agriculture have been made, but this is unincentivising for the majority who lack passports and visas. A lack of credentials makes return more difficult too. To combat this and the problem of bribery and corruption of border officials by human traffickers, the Laotian government is collaborating with varios NGOs like Save the Children and CARE International with the “3P Plan” - prevention, protection and prosecution. In 2017 the largest crackdown and initiatives to ensure victims do not become victimised again were established but there is little evidenceof its success.
Further to this, interdependence with Thailand is very significant. The majority of these migrants are unskilled labourers - but both countries benefit bilaterally thorough the 4x greater minimum wage in Thailand. The growing textiles and service sector are supported by Laotians who remit money - 2% of GDP - which is used on the local scale of food and essential resources (building resilience in the long-term) and large agricultural machinery - essential in such an economy.
Laos and Thailand also jointly manage the Mekong river, inheritly improving political relations.
Opportunities
- Laos has received FDI from Vietnam in over 400 investment projects
- Remittances over time should contribute to a multiplier effect as seen in other LIDCs
- High-speed rail will allow more development internally and greater movement of people between China, Vietnam, and Thailand. As Laos is very central it has a special relationship over this
- Political stability is increasingly good in this area
- The ASEAN migration corridor stimulates economic activities with trade and development.
Challenges
- Low education, low skill labour still predominant
- Most migration remains illegal and many are exploited
- Greater political freedoms and free movement in ASEAN countries may exacerbate losses especially with wage differentials
- Lao’s garment industry companies may fail to keep up with demand due to being outpriced by competition
- People with high-skill labour including carpenters are - for the moment - are simply more likely to migrate out and seldom return, suppressing wages and creating relative inequalities.
2.1 – Changing Spaces; Making Places
What’s in a place?
1.a. Places are multi-faceted, shaped by shifting flows and connections which change over time.
A place can be described as a location created by human experiences.
A space, on the other hand, has no added social connections or added perceived values.
For example, a car parking space at a shopping market has no value to you. It’s just a one time location which you leave your car at. However, a parking place at your work may have your name on it, it may be valued by yourself and there may be some memories associated with it, such as tripping over or talking to someone there.
One person’s place may be another’s space.
Places can have different connections and perceptions. These are also likely to change over time. For example, 10 Downing Street may be perceived by characteristics, such as being a centre for political power, socioeconomic decisions or even for Larry the Cat who’s there. It also has many factors which determine how people perceive it, such as the current political affiliation or recent decisions made by the people inside.
Place Identity is a combination of many characteristics that comprise a place. These factors include:
- socioeconomic (housing tenure, employment, income)
- political (national and regional government)
- cultural (religion, traditions, societies)
- physical (altitude, geology, proximity to natural features like rivers)
- demographic (ethnicity, age, gender)
- the built environment (building materials, ages, density)
Places are multi-faceted, shaped by shifting flows and connections which change over time. This can be seen with Canary Wharf, which is now a hub for businesses, bing banks, trade and commerce. It was part of the London Docklands, which became gentrified after the decline of the shipment industry. Flats were demolished and rebranded from old, contaminated stockhouses to new entrepreneurial small businesses and now high-rise, technologically advanced buildings coupled with bars, cafés and waterside views, giving it a sense of identity. To the people who work there or go there regularly, this is a place, not just a space.
Case study: Place Profile - Mancroft Ward, Norwich
A ward is an administrative region of a city or borough, electing its own councillor.
Physical Geography
Norwich is located on the River Wensum, flowing through the city. It is surrounded by many rivers and tributaries like the Yare and Waverley. These rivers have played an important role in the development of the region and city, both for industry and for transport. The geology is mostly composed of sandstone and chalk, used historically in the buildings, being durable. This style has been seen in the castle, while flints are used in many of the churches.
Political
Norwich is governed by Norwich City Council. The city has 39 city councillors, with 13 electoral wards, each having three councillors who undertake casework for constituents, making council policies, budgeting and service delivery. The county council runs education services as well as social care and transport.
Bonus info: the Russell Street Community Area Residents Association is a group of people within the Mancroft Ward who discuss local issues such as litter, tackling homelessness and lonliness, meeting monthly, and using platforms like Facebook to communicate to make the area more pleasant to live in.
May 2022 Council Election Results. Turnout 35.3%
| Candidate Name | Political Party | Votes | Elected |
|---|---|---|---|
| Carrington Jess | Labour and Co-operative Party | 691 | |
| Dean Gordon Richard | Liberal Democrats | 55 | |
| Gwynn Iain Michael Morgan | The Conservative Party Candidate | 243 | |
| Osborn Jamie | The Green Party | 1,606 | X |
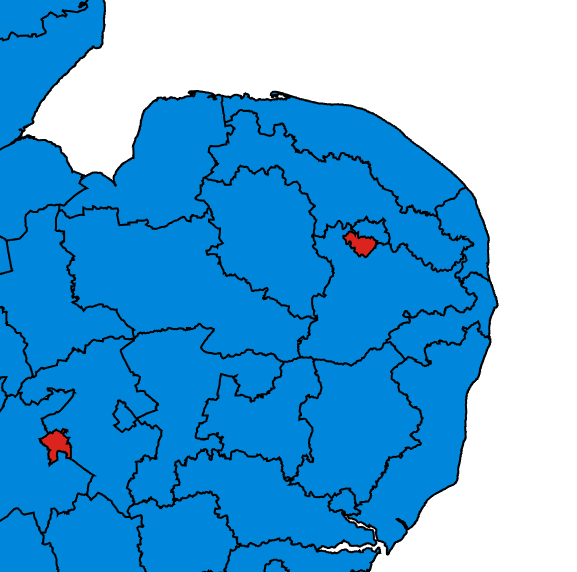
Mancroft is part of Norwich South for general elections. In 2019, it was one of two districts to vote Labour in the East
Built Environment
Mancroft is home to a variety of architectural styles and ages, ranging from the 15th century to the modern day. Examples of 15th century buildings include the Guildhall, whilst 19th century developments include the Royal Arcade. The skyline is generally low-rise.
The ward also contains two modern, innovative shopping centre developments, Chantry Place and Castle Quarter. Furthermore, The Forum is a modern development in amongst the 499 listed buildings. Very diverse, e.g. Norwich Market with various stalls from tearooms, army equipment, Italian street food to Indian scents and spices - reflecting the diversity of the ward (and city as a whole!) and demands for these foods. The ward’s population density at is also 10 times the UK average, having approximately 5,000 homes.
History
The ward itself is named after St Peter Mancroft alongside the parish church. There are two cathedrals and a castle in the city, one of which is in the ward, which itself is very rare across the UK. The name originated from the Latin term “Magna Crofta”, or “Great Field”. It used to be the second largest and most important city in England before industrialisation occurred. There was a strong trade bond with the Netherlands through the River Wensum, which extends out into the North Sea that allowed for easy boat transport. To this day, some of the city’s walls which surround this area are still in good shape thanks to their listed status such as Cow Tower and Black Tower.
Demography
2021 population:
- 10,618 people. 2.012km2 with 5,252 people per km2.
- Annual population change is 3.2%, from 2011 to 2021.
- There are 10 more males than females at 5,313 men, showing a very even distribution.
- 84.4% white, 6.8% Asian, 3.3% black, mixed race 3.5%
- 77% of the population originated the UK, 23% were foreign born residents, of which 9.9% are from EU countries.
- The highest population in age distribution bracket is 20-29 years, which contains 2,740 people
Least religious city in the UK! with 57.8% saying they have no religious affiliation! Christianity is still the second most popular, and Islam is third, with religions at 33.5% and 3.5% respectively.
Socio-economic
Mancroft is categorised as a built-up area alongside most of Norwich by the ONS. Large amounts of flats, apartments in a close proximity suggests that there are many employers and jobs available within the region and city, so employees can easily access these facilities.
11% of the ward are retired and therefore less economically active. There are also 866 students and the most will be paying rent and working, contributing to local economy. There are 5353 economically active people, while there are 2466 economically inactive residents.
Furthermore, the average income is £32,000, showing that there are many professional jobs being occupied. This means that there is a reasonable amount of disposable income for residents to spend on facilities and more recreational activities, such as supporting local cafes which tend to be at a higher price.
The majority of homes have 3-4 rooms (not just bedrooms), suggesting that the majority of people in the area are either single, students, or in a relationship without children. There are 5708 homes in total, with 3188 people living alone. This data implies that there are many workers living in smaller, urban dwellings. When families are formed, they then go on to move away from the inner city area and potentially to more suburban areas outside of Mancroft.
These statistics reflect the average “life progression”, with people working in inner city jobs or are students during thier early 20s due to work facilities available, nightclubs and nightlife (being more ‘adventurous’), but then settle in a more comfortable job and have families, moving to more remove areas with a larger house to take care of children.
Overall, Mancroft is a built-up area with a high population density, suggesting that it contains a large amount of flats and buildings in close proximity. The population is diverse, with 11.07% of the ward being retired, 866 students, 5,353 economically active people aged between 16 and 74, and 2,466 people economically inactive. The majority of homes have 3 or 4 rooms, with an average of 2.51 people per household, suggesting that the area is mainly occupied by single people or very small families. This data implies that Mancroft is a roughly working to lower middle-class area (also inferred by its political affiliation) with many workers living in smaller houses, and families would then go on to move away from this area in the city centre with increased affluency and more likely to be middle-class.
Case study: Place Profile - Sheringham North Ward, North Norfolk
Physical Geography
Sheringham is situated on the North Norfolk coast. One of the highest points in Norfolk is located in western Sheringham, known as the “Beeston Bump” locally. It is 73 metres high and is made up of old glacial moraines dating from the end of the Pleistocene epoch eround 11 to 13,000 years ago, when northern advancing glaciers retreated. It is made out of sand, gravel and stones.
For this reason, and the proximity to the coast, it was used to protect the homes behind it, being less prone to erosion from the sea due to the increased mass to erode. There also used to be two villages behind this bump, which have now merged into one larger conurbation. (It used to be two roughly symmetrical hills that has now merged into one, just like the conurbation!).
The coastal cliffs in the area are made of sedimentary rocks such as chalk, clay and flint, which have provided the region with building materials and is why there are many small cottages or other buildings in the area made of flint.
There’s also a lot of prominent erosional processes and westwards longshore drift, resulting in sandy beaches and the necessity of groynes on the beach to maintain this sand.
Political
Sheringham is part of North Norfolk in general elections. In the 2019 general election, 58.6% of the vote was Conservative (up from the UK average of 43.6%) , which was a gain of 16.9% of the vote since the previous year’s election.
The Labour Party made up just 7.7% (compared to 32.1% in the UK) and the Lib Dems made up the second largest party at 30.3%, with a respective decline of 2.2% and 18.1%. 58.9% of North Norfolk, which included Sheringham, voted to leave the European Union in 2016. The MP, Duncan Baker, was a member of the UKIP party before the Brexit campaign.
Built Environment
Flint is the most common and naturally abundant material in Norfolk, particularly for the building of cottages. This is especially pronounced in coastal areas such as in Sheringham North Ward. Flint is also an iconic material for attracting tourism, in addition to typically costing more to use than bricks. The built environment ressembles more of a postcard town.
History
It was ‘created’ in 1086. The land was owned by William d’Ecouis. The Domesday entry lists public land, slaves, farm animals, churches and more in modern-day Sheringham.
In the late 1800s it was a major crab and lobster fishing centre and supplied London markets using new railway routes brought about from industrialisation from the 200+ fishing boats and companies which regularly went out from the port at this time. Many large business owners who had lots of money to spend, especially during the industrialisation period, bought large mansions or constructed their own buildings in the area, which created a snowball effect with other businessmen
It continued to be popular for particularly more wealthy and affluent people as holidays throughout the 20th century. From the 1950s and up onwards it has continued to attract elderly people for retirement due to its peaceful and serene atmosphere as well as having good coastal views and sufficient amenities.
Demography
In Sheringham North, the population in 2021 during the last census was 2,470. 98.1% of the population were white British. There were only four black residents.
The highest population age distribution bracket was between the 70 and 79 years age range with 464 people. Furthermore, 39.4% of the entire population are aged above 65. Just over half, at 50.8%, are between 15 and 64 years old. Of this total, 95% come from the UK.
The population has actually decreased from 3002 in 2011.
Socio-economic
In Sheringham North, there are 622 households with one person with a serious health condition, meaning that they cannot work. There are 64.7% of men who are economically active, compared to 59.6% of women economically active, meaning that 35 and 40% of them are inactive in the economy, respectively. 29.66% of people are managers, directors or senior officials and in professional occupations.
This shows that there may be an upcoming problem for the council and town planners as these older people continue to age, more accessible features will have to be put in place to support them.
Average costs for a terraced house are £223,500 to £312,500. For a semi-detached house, this is £250,000 to £364,500. A detached house costs typically over over £400,000.
Place Profile Comparisons
Sheringham has a much older demographic with an average age of 51 years compared to 37 in Mancroft. This may result in more services like bingos and buses, with less schooling in Sheringham. Sheringham may also be less reluctant to change, not only because of the older population who are typically less accepting of new ideas and visions, but the people living there may spend more time retired compared to the lower, younger, more accepting population like students who may only spend 2-3 years in the area, who may be less inclined to travel further away to places such as Cromer to get their shopping done as they do not have as much time as the older, retired population.
Shifting flows of money, investment and ideas
Norwich first started as a Saxon marketplace in the 800s and 900s, exporting wool. Throughout the Middle Ages, it was England’s second largest city.
During the Industrial Revolution, there was a large amount of rural to urban migration who powered new industries such as the mustard and chocolate factories.
It became a centre for textiles and shoemaking until the early 1900s. The ex-largest insurance company, Aviva, or Norwich Union, was established in the 16th century and then proceeded to go global.
Norwich was relatively isolated until the railway arrived in 1846. It was faster to go to Amsterdam by boat than travel to London.
Since then, it has had a complete revolution. Norwich is now the eighth most prosperous shopping location in the UK, with old-fashioned industrial buildings and factories being redeveloped and gentrified into new places such as Riverside, Castle Quarter, and Chantry Place. And definitely not Anglia Square.
There has been a constant flow of students and academics in the area, fuelled by the UEA, which has close connections to world-renowned Cambridge Universities. The UEA also houses the John Innes Centre, which has provided global breakthroughs in the fields of biology and sciences, and Tyndall Centre for Climate Change, equally as significant. This has transformed the economy into a quaternary knowledge economy, supporting high-tech and scientific quaternary sector jobs, comparing to around 250 years ago, when it was just primary and secondary sector hub, involving large amounts of manufacturing and farm labour.
Norwich is a commuter town too, with people coming into work from surrounding villages, and good transport links with goods moved into Norfolk via the M11 and A14. This has continued to attract investment by transnational corporations.
Shifting flows of people
At the heart of it, people are what turn a space into a multifaceted place. The exact stage in people’s lives determines and influence where people live. For example, the location and housing tenureand house type, and by extent, the place profile.
The local availability of a resource or natural advantage can encourage the growth of a settlement and mould its identity by fuelling industry. If these resources run out or global shift occurs for a particular product, technology typically takes over the natural advantage and the place profile can and often change. In Norwich, this global shift means that it has become cheaper and easier to manufacture goods like shoes and chocolate overseas and import it, leading to the replacement of local resources. Ocean-going ships have grown significantly in size and can no longer fit up the River Yare, so the riverside docklands fell into decline, much like the London Docklands. However, with shifting flows of people, opportunities have arisen in these areas, which are now shopping hubs and entrepreneurial centres of investment.
How do we understand place?
2.a) People see, experience and understand place in different ways, this can also change over time.
2.b) Places are represented through a variety of contrasting formal and informal agencies.
Places are represented differently through formal and informal factors.
How and why people perceive places differently
Place Perception: Uluru and Jerusalem
- Religious and emotional attachment.
Emotional attachment: The Kurds and Kurdistan
Globalisation and our sense of place
Globalisation and time-space compression contribute to the feelings of a “shrinking world”. There is increasing interconnectedness due to massevely increased trade and cultural links; containerisation popularised in 1956 by McLean has resulted in goods being traded faster, cheaper and in greater quantity. The communications revolution has promoted the sharing and flows of ideas, knowledge and technology, now measured in milliseconds with the internet.
Exotic and far-away nations that were once perceived to be luxurious and out-of-reach can be reached in hours, not weeks.
The “global village” means that there are now global communties where people can meet, share ideas and have common interests; our sense of “place” now may be not just in the real world but also in platforms online and “places” to hang out in messaging boards and group chats.
Places in ACs may be characterised by less pollution, fewer unskilled labour with the decline of industry. However, large factories may remain, increasing crime and leaching from contaminated factories may give places a unique identity. Theses previously exotic countries - most likely LIDCs - may receive the other end, with increased contamination, rapid rural-urban migration fuelling slum settlements, and exploitative employers leaving a negative perception of the place amongst its own residents.
Cultures and religions may increasingly be less and less influential in how we feel about places. Increased homogenisation of cultures, transnational corporations (Nike, McDonald’s)wanting to make their presence known on every high street and the disappearance of old traditions as young people become enveloped by social media are contributing to a feel of uniformity within towns and cities worldwide. The “clone town” index was made to study this phenomenon.
Economic change and patterns of social inequality
3.a. The distribution of resources, wealth and opportunities are not evenly spread within and between places.
3.b. Processes of economic change can create opportunities for some while creating and exacerbating social inequality for others.
3.c. Social inequality impacts people and places in different ways.
[TBD] Measuring Social Inequality
Book reference: pages 158-162
Social inequality can be measured through various means. In the UK, the IMD is a composite statistic that comprises 7 domains with varying weightings: income and employment account for 50%, followed by education and health at 13.5%, and finally (barriers to) housing and services, crime and the living environment at 9.3%.
The Gini coefficient is used to measure the inequality of income and thereby deprivation within countries. Here is the UK stats on the ONS website.
Case study: MIDDLESBROUGH
Middlesborough is a region in north-east England.
A harsh cycle of deprivation has occured after global shift and deindustrialisation away from coal, steel and the chemical industry. 38% of children are in poverty - which has grown since 2014 in a time when the UK child poverty rates have decreased by 2%. More than half of the LSOAs in Middlesbrough are in the 10% most deprived. It ranks16th of the UK’s 317 LAs.
North Ormesby Ward was the 3rd most deprived out of the 7,180 in the UK.
- Middlesbrough’s average household income is £24,900
- Life expectancies up to 11 years lower than the national average,
https://www.gazettelive.co.uk/news/teesside-news/teesside-town-residents-13200-poorer-28502866
Case study: HART, HAMPSHIRE
Hart and the town of Fleet within are the least deprived LA and LSOA in England, ranking in 317 of the 317 least deprived LAs. The positioning - 45km SW of London and 50km N of ports like Portsmouth give it a commuter settlement status, allowing for the benefits of high salaries without burden of higher living costs. These high salaries allow for greater disposable income - avg house is worth over £462,000, and over 80% being detached and either owned outright or on a mortgage. This may be facilitated by the 37.5% of adults with a degree (10% higher than the national average)
- Average life expectancies are 2-4 years higher than the national avg.
- Fleet’s average household income is £52,000 - over double that of Middlesbrough.
Players that impact on economic change
4.a. Places are influenced by a range of players operating at different scales.
Players, or stakeholders, are individuals, groups of people or organisations who can influence, or are influenced by, changes occurring in an area. They have a common interest in a place.
Governments or local authorities who may be interested in economic development, redevelopment or rebranding of an area typically have more (economic) power and influence over, for example, somebody whose house is in the path of a flagship development.
Examples of players that influence an area include:
- national government (planning, transport links like HS2, stimulating growth and development)
- the EU (through grants for infrastructure and sustainable development projects)
- local governments (investments in housing, building and improving services)
- TNCs (especially those with investments in an area, or looking to break into a new market)
- local communities (residents’ associations to improve social, economic, environmental and political matters in their area)
- NGOs (charities with an interest in e.g. wildlife/nature conservation)
The development of a bypass, such as the Norwich NDR, has so many players. Local businesses may be in favour, with greater infrastructure allowing for faster goods movement and greater flows of goods. Farmers may benefit from national government payouts to sell land to build this road. Environmental groups may be unhappy with the noise and reduction of habitat for endangered species. There is a general trend of (supra)national government and large TNCs being in favour of developments and economic change in an area, whilst smaller, local groups may be typically against such changes, from shopping centres such as Anglia Square in cities, to rural settlements.
Case study: Structural economic change, Birmingham
This case study can also be used in Placemaking (5.c)
The first sign of economic change in Birmingham, now England’s second city with a population of over 1.1 million in the metropolitan area, took place in 1166, when the de Bermingham family purchased a royal charter, permitting the holding of a market in the area. As such, it became recognised as a hub for trading, as opposed to agriculture, and has continued to grow to the present day.
The rise of Birmingham
Birmingham before the industrial revolution was a place of hard work and manufacturing, especially metalworking. The geology of the surrounding region and Black Country supplied Birmingham with adequate metals and coal to smelt the metals. By 1563, the historian William Camden stated that the area was “swarming” with people and “echoing with the noise of anvils”. The good supply of water thanks to the topography allowed more and more resource-intensive products to be made. During this time, the demographic was principally white with the Church present throughout; this intensive labour required young male labourers and did not change much. Smiths and the market were selling goods across England by this time. Produce included gun cartridges, horseshoes and brass.
The Industrial Revolution kicked economic changes into overdrive. The population by 1710 was 15,000 fuelled by continued urban-rural migration. A middle class and tertiary sector emerged during this period, creating Lloyds and Midlands Bank - the former founded in 1765. The main secondary sector manufacturing industries required the services of tertiary sector companies and thus created demand between differing sectors and these relationships increased confidence and investment in the town. The canal system allowed more trade, with even more goods being imported and exported.
The first factory in the world, the “Soho Manufactory”, was created by Matthew Boulton in 1761 which streamlined the industrial manufacturing process with one single production line with 700 employees all in the same area, producing more goods in a faster time. Boulton and Watt would also partner to produce steam engines that would be sold across the country. Electroplating and the pneumatic tyre were just some of the new inventions that Birmingham produced.
As this economic growth supported continuous population increases, there was more demand to house these people. The Cadbury chocolate family in the early-mid 1800s set up the Bourneville factory and village, introducing the new food processing industry and bucked the trend of terraced housing with the insistence of George Cadbury to have large homes with gardens and sizeable rooms to ensure the best working conditions for each employee and their families - encouraging social reforms whilst positively influencing industry and the local economy. Birmingham truly became “a city of a thousand trades”. At this time the (long overdue) railway connection to London was made and was the hub of the Midlands, connecting the north to the south, and east to the west. (And this is true even today!)
The 1900s saw yet more opportunities. The Austin car plant brought car and vehicle manufacturing; the Dunlop tyre company brought… well… tyres. Companies were established to supply larger companies with goods - contributing to the very low unemployment rate of under 1% as there was effectively money to be made everywhere through these ancillary industries. This demand also made its way into other sectors - with metalworking “only” accounting for half of the employment in Birmingham by 1950. Squeezing even more people into poor-quality terraces drove transport improvements while the middle class drove the expansion of the metropolitan area. The “largest social housing estates in the country” were also located in the city suburbs.
War and post-war decline
Artillery, aircraft and weaponry were understandably prioritised during the Second World War. Unemployment remained low but the population, like all towns and cities, shrunk from 1.2m to 1m.
The war also left its mark on the infrastructure. The Birmingham Blitz destroyed over 12,000 homes. LA realised 110k homes were sub-standard and began mass demolishment and replaced them with 400 modern tower blocks and 81,000 new homes. Increased QoL with more contemporary living spaces.
By 1970s:
- The British vehicle industry had been in decline for 20 years. Preference for Japanese models, cheaper costs w/global shift and globalisation and demand for these cars favoured them vs British makes
- SMEs that used to act as ancillary industries or make their own resources demolished in slum clearance schemes. Many were unable to find other suitable cheap businesses; areas that were supposed to encourage this priced out smaller, family-run businesses.
- Demographic changes: the Windrush generation had arrived by this time, and combined with higher immigration, the amount of non-white British people had doubled to around 10%
- Unemployment rates hit 19.4%.
The clearance and resettlement schemes pushed out residents into more affluent outer-city areas: increased commuting costs and more affluent expectations and lifestyles left lower disposable income for lower-skilled residents. A green belt was later created, shifting land values.
The Government did not give any grants to the EU car companies such as VW to incentivise (re)development in the East Midlands thanks to its prior growth and prosperity - other areas that needed this even more were prioritised. (positive feedback). The Single Regeneration Budget in the 20th Century that tackled deep-rooted social inequalities was criticised due to its administrative and bureaucratic costs but has shown success in the reduction of deprived regions with gentrification, but without forcing low-income residents out. Labour’s 1997 New Deal for Communities also saw to tackle the most deprived regions with improvements in crime, education an employment, and even saw new broadband internet access installed in city centre homes, helping to reduce the digital divide and allow people to see job opportunities and education online.
Modern-day Birmingham
A large number of migrants from the Indian subcontinent was recorded in the 1991 census. 25% were now non-British, largely driven by the increase in tertiary sector work and 3D jobs. By 2011, this share had increased to 49%.
The national government’s grant scheme to encourage FDI was not used in Birmingham, due to other areas of the UK, notably the northeast, that had undergone even more significant deindustrialisation being prioritised. This lack of investment further decreased prosperity and exacerbated inequalities by not providing the still large secondary sector with opportunities to work
It was the EU Social Investment fund that helped regenerate areas of the city, with £450m investment in changing social housing. Some of this has been matched post-Brexit from the UK Shared Prosperity fund but not all; it is essential for low-income families.
Over 50,000 students are present in the 5 city universities. They work, and spend time and money in the area, kickstarting a positive multiplier effect.
Finally, the Birmingham Development Plan at the LA level is ensuring that a combination of these goals continues.
Overall roles of players
- de Bermingham family: 1166, royal charter. Immediately changed the industry from
Placemaking processes
5.a. Place is produced in a variety of ways at different scales.
5.b. The placemaking process of rebranding constructs a different place meaning through reimaging and regeneration.
5.c. Making a successful place requires planning and design.
Placemaking is the process of transforming public spaces into places that work for people.
Successful placemaking requires efforts from all scales of players. Community intervention and consultation, local councils, planners, architects, community groups, and NGOs are just some of the stakeholders involved. These players should all take into consideration an area’s heritage, culture, creativity, green spaces and more in attempting to make a better place.
Hulme Crescents
Built as Europe’s largest social housing development in 1972 in Manchester, poor architecture and planning resulted in several practicality and construction failures and oversights. The over 3,200 deck access properties were unpoliced, and crime was high. Thick concrete led to a sense of isolation, a child fell and died from a balcony, heating was expensive, vermin infested the decks, and became abandoned by the council in 12 years. 22 years after construction, they were demolished.
Through the City Challenge redevelopment, they were replaced by more traditional apartments that were safe for families, with a central park, with semi-detached and terraced housing that was of high quality and low-rise and - critically, much was social housing. There was a focus on personal mobility, without the need to travel up several flights of stairs in the prior crescents.
Case study: Dubai’s transformation
From fishing village to diverse economic powerhouse.
After realising that oil would not be an unlimited resource, the Sheikh diversfied from 1970.
The Jebel Ali Free Zone was established, today allowing 200,000 companies to operate in Dubai, using its excellent positioning. Along with flagship developments such as the Burj Khalifa (828m in 2008) the real estate sector has grown to US$25bn.
[tbd] 2.2.3 Global Governance: Option C – Human Rights
Overview
Human rights are a universal set of basic rights that everyone is entitled to at all times and in all places, protecting everyone equally and indiscriminately.
The UDHR was written after WW2 as a framework to establish these rights. Whilst very morally strong and well-respected, it is not legally binding.
States therefore sign treaties to codify the set of human rights into compatible domestic legislation. One of these is the UN Convention on the Rights of the Child - which outlines what a child must need to survive, grow and reach their full potential, and is the basis for Unicef’s work. This is the most widely ratified piece of legislation.
To encourage codification, states may place trade sanctions or embargoes on others that do not ratify or enforce rules against human rights violations.
According to UNICEF, social norms are the perceived “unwritten rules” that define acceptable and appropriate actions and behaviours within a group or community.
Intervention refers to activity taken by a nation to manipulate the economy, society or the political structure of another nation. This can be done through:
- geopolitical intervention: by placing strategic trade embargoes, aid or military action
- military intervention: by using its and allies’ military forces to forcefully take control of another country, or areas of it
Forced labour is not literally being forced to work. It refers to when people are trapped or have no other choice. The ILO defines it as when people are coerced through violence or manipulation, or more subtly through the accumulation of debt or threat of denunciation to authorities. For example:
- the Kafala system in Middle Eastern states, used by the UAE during preparation for the World Cup, involved employers confiscating and changing the terms of contracts so people were effectively forced to work for longer. Employers have been known to go bankrupt and migrants are effectively trapped in their destination country.
- debts to employers and people smugglers across the world are a huge business - people may sign contracts with agencies or loaned money to be transported, and can only be transported back home if they pay this back.
- bonded labour - when a person’s work is used as a form of repayment of prior debt or loan. Especially in positions of authority, with no formal contracts, or where the liberties of the person depend on the repayment, the person to whom the debt is owed can effectively demand the services indefinitely.
Bonded labour is today most common in caste societies, especially in India, but also includes Pakistan and Nepal.
Capital punishment and the death penalty have been eliminated in most countries. It is most common in dictatorships or monarchies - such as Saudi Arabia, Iran and Iraq, but also the USA. China is the largest country with possibly the greatest amount of executions, however, many countries do not disclose their numbers or let journalists publish them - though fear that they will become executed. There were 883 known executions in 2022.
In some countries it is still lawful, however, many seldom use it or reserve it for the worst possible crimes - but it is up to the jurisdiction to decide.
Maternal mortality is the death of a woman during or 42 days after the termination of, pregnancy or birth, from any cause related or aggravated by the pregnancy or its management. The MMR is the rate of these deaths per 100,000 births. Trends that influence MMR include:
- Fewer doctors to guide through childbirth/perform legal abortions
- Fewer healthcare facilities may result in antenatal or postnatal care being less effective - complications may arise
- Abortions may be illegal or taboo in countries and cultures, risking the mother and the child
- Countries may be patriarchal and the dowry may incentivise the selling of young girls aged 14 or lower to be married (e.g. Iraq), substantially increasing complications as bodies may not be fully developed
- Lower levels of education regarding contraceptives, hygiene or how to deliver a baby (vs prenatal classes or education programs)
- Paid maternity leave (e.g. USA) may not exist, resulting in people working as late into pregnancy and as early after delivery without letting their body recover (stress)
- Lack of nationalised or free healthcare may discourage people with hypertension or haemorrhages from seeking help until it becomes fatal.
The vast majority of maternal deaths can be avoided, therefore, it is not just a question of development but also of human rights.
Gender inequality
Women’s rights are measured through the GGGI - the Global Gender Gap Index by the World Economic Forum. It is a percentage score that calculates the relative equality of women compared to men. It’s measured through:
- economic participation and equal opportunities;
- educational attainment;
- health and survival;
- political empowerment.
As of 2023, no country has closed this gap.
Social norms are a barrier to gender equality.
Costs for education may be a barrier to female educational attainment: boys and men may be regarded as the traditional “breadwinners”, depriving women of access. Or, in patriarchal societies, female education may not be prioritised as they are expected to marry into another family. Young men migrating may also leave the burden of housework on the daughters, and likewise, those being married through dowry systems are expected to take care of the husband’s family.
In Rwanda, the genocide in 1994 resulted in over 1 million men being killed, and the effective requirement of women to fill the gaps left by the male workforce. This completely upheld the social norms present and, even today, the central African country has a female:male workforce participation ratio of 100:85, and ranks 5th in the world on the GGGI.
Case study: INDIA
India, aside from having th largest population with some amazing people, is a rapidly developing EDC with a GDP per capita of US $2410, almost double its 2012 value, and significantly higher than its 2002 value of US $468.8. However, India was positioned at 127 out of 146 countries in terms of its GGGI and, although increasing it score (and equality) since 2012, is slowing down the rate at which it is closing the gap.
The government has recently introduced various means of combatting the arguably entrenched social norms. In 1961 the Prohibition of Dowry Act was introduced, and has been amended several times since. The Prohibition of Child Marriage Act was enacted in 2006 - aiming to reduce the 36 million children married as children in regions such as Uttar Pradesh.
India has ratified CEDAW - that aims for the “full advancement of women as equals” - something that the USA has not done yet. Forward-thinking policies - such as a 2023 bill to require at least 30% of the parliamentary seats to be held by women - exemplify how the legislature is attempting to reduce womens’ inequalities and make society more equal. Moreover, grassroots, local “on the ground approaches” including the “Safe Cities” network by the International Centre for Research on Women (ICRW) and the “Safe Delhi Campaign” are attempting to give women more confidence and provide a means for women to be able to report crimes without fear of persecution - including the over 140,000 cases of domestic abuse by the husband or relatives. The “Beti Bachao, Beti Padhao” campaign has also been successful in changing attitudes towards saving and educating girls in northern districts of India.
However, despite this, social norms undoubtedly play a great role in the halting of gender equality progression. With the majority of India’s 1.4bn residents in rural communities, the sheer size of the country and policing of issues not being a priority, it’s not surprising that there is a lack of GGGI improvement. These rural communities require large-scale but local approaches to tackle inequalities - simply unrealistic on this scale - thus the subservient ideas surrounding women is reinforced. However, over time, the forward-thinking legislation should enforce educational mandates with the ability and equality of women and men shoud be realised.
Due to legislation changes, there is some societal change being made in the country. Companies which arguably have great influence on societal changes are forced to abide by the laws, and through corporate responsibility, these ideas may trickle down over time from the legislature to civilians.
- 52% women believe that it is acceptable for men to beat their wife
- 63% of Delhi’s women fear of going out at night
- Only 1% of Delhi’s residents say they never worry if a female member of the household at any time
Calling husbands by their name for the first time - BBC News
“Dalits” - lowest form of caste
Strategies for global governance
Human rights violations can be a cause and consequence of conflict. Conflict can be caused by:
- the denial of basic needs including food, water, housing, education and employment (over long time scales)
- discrimination - within a society, through political exclusion and injustices
- lack of free and fair democratic systems
- oppressive or corrput governments that do not respect all groups
- genocide, ethnic cleansing and torture
Confict itself may cause futher human rights violations.
- deaths and injuries in men, women and children both combattants and civilians in zones of conflict
- lack of access to food, water and basic resources through damaged infrastructure
- provocation of internal and intenational migration and conditions of refugees and asylum seekers
- abuse of power by militants on women and children
- more genocide, ethnic cleansing and torture
Flows and geopolitical intervention
People fundamentally drive effective intervention. Where there is seen to be human rights abuses, supranational organisations including the UNHCR and also NGOs such as Amnesty International and Human Rights Watch gather and publish information to increase awareness to the international scale, with pressure placed on governments globally to intervene.
Technology has a very important role today. Media can be uploaded instantly in areas with abuses as direct evidence of abuses, seen with the many social media videos in warzones. Trends become visible worldwide to anyone at the click of a button. During intervention, the internet allows people to communicate with charities for aid, and announcements can be made for humanitarian corridors and ceasefires - allowing vital movement and support for civilians. Remote sensing, drones, GPS and surveillance in areas with high tension and where it is risky to deploy troops to reduce the loss of life and futher abuses.
Aid workers and funding from supranational organisations also demonstrate this. It requires a huge amount of funding for UN peacekeeping missions and NATO “missions” - both in terms of people and the military equipment deployed to areas of conflict.
Since invasion, NATO has spent over US $2.13tn on Afghanistan (see below), most of which has gone to military expenses.
Promotion and protection
- The United Nations has various obligations in its charter.
Case study: AFGHANISTAN, an area of conflict
Afghanistan prior to 2001 was in a dire geopolitical situation. Sharia law (very strict Islam) banned any form of media such as televisions and the arts, required women to wear a burka, disallowed girls over 10 their education (and no chance for employment), held public executions as a way to show the strength of the Taliban government and amputations for petty crimes. In addition, all other religions were disallowed, journalists were attacked regularly and, due to the government’s illegitimacy, made NGO and charity support almost impossible.
There were a range of human rights violations. Gender rights were by far the lowest of any country with zero women completing primary and secondary education, high maternal mortality rates of 1,450 per 100,000 in 2000. The rights of the child were violated, with just 1.1 million boys in education (for comparison, by 2018 there were 5 million more boys and 3.6 million (more) girls in primary/secondary education). Food insecurity was also widespread:
87% of women even during intervention in 2018 were still subject to any type of violence.
Within 1 year of intervention: 3x increase in children in education from 800k to just under 3 mil; in 2002 the amount of girls in education was more than all children in 2001.
Consequences
War and conflict is the most obvious direct result of intervention.
- 45k Nato-trained Afghan security forces dead
- 38k civilian casualties
However, there have been changes made in rural and urban neighbourhoods:
Rural
- UNICEF have provided remote, community-first schoolsand “safe havens” for children at risk of domestic abuse, child marriage, labour and soldiers, and vaccinations.
- UNDP: rural uphold of local demoracy and developments in regional councils to request funding
- USAID and the UN World Food Programme: giving rural farmers (such as those in the Ghor province) nutrition, and teeaching about agriculture, increasing resilience, employment and incomes
Urban
UN Habitat have worked with the Afghan government, NGOs on the ground, and taken in external investment from governments such as Japan’s to build locally-elected Community Development Councils, and funding to “upgrade” neighbourhoods.
- These CDCs are locally-elected in the regions, with 50% women (increasing visibility, reducing discrimination and allowing employment) that can vote and prioritise plans to improve housing, sanitation, electricity and infrastructure in urban regions.
- This has resulted in there being 1.1 million new grid connections during the intervention.
Withdrawal?
The withdrawal has had a dramatic negative effect on the ountry, however, proves the positive effect that intervention can have on a country. Since 2021 the Fall of Kabul has erased much of the progress, with women again no longer able to work and complete a secondary education or be unaccompanied in public spaces. This applies beyond citizens: as women are unable to work, many NGOs and supranational organisations including Save the Children, CARE International and Islamic Relief have been forced to suspend aid and development programs source.
Intervention and development
Case Study: the DEMOCRATIC REPUBLIC of the CONGO
The DRC is a central African LIDC with an HDI of 0.459. Its capital is Kinshasa. The country has male life expectancies of 59 and female life expectancy of 63. The GDP per capita is just $785 across a country with 101m inhabitants.
Conflict and human rights violations are widespread as a result of internal conflict, historic corruption and poverty. ~75% live in absolute poverty (< $2.15/day) and artisinal mining is widespread with children being exploited in dangerous gold and lithium mines, and as child soldiers.
Currently MONUSCO - a UN peacekeeping and stabilisation force - are present and there are around 18,000 personnel on the eastern side of the country - the majority are troops, due to insurgence of violence known as the “Goma conflict”. Internal conflict broke out after the Rwandan genocide and mass exodus of over a million Ugandans into the fagile DRC.
- Becoming more stable: first electons in 2019 were peaceful
- CARE International, Action Aid and the World Bank are working to improve access across the country to education and healthcare services (half of young women are illiterate).
Congolese
end of paper 2
good luck in Paper 3! Hazards are my favourite <3 (sorry drumlins)
Paper 3 - Geographical Debates
[TBD] Disease Dilemmas
Last update: 15/01/2024 22:38
Word count: 4,807 (25,446 characters)
1. Global patterns of disease
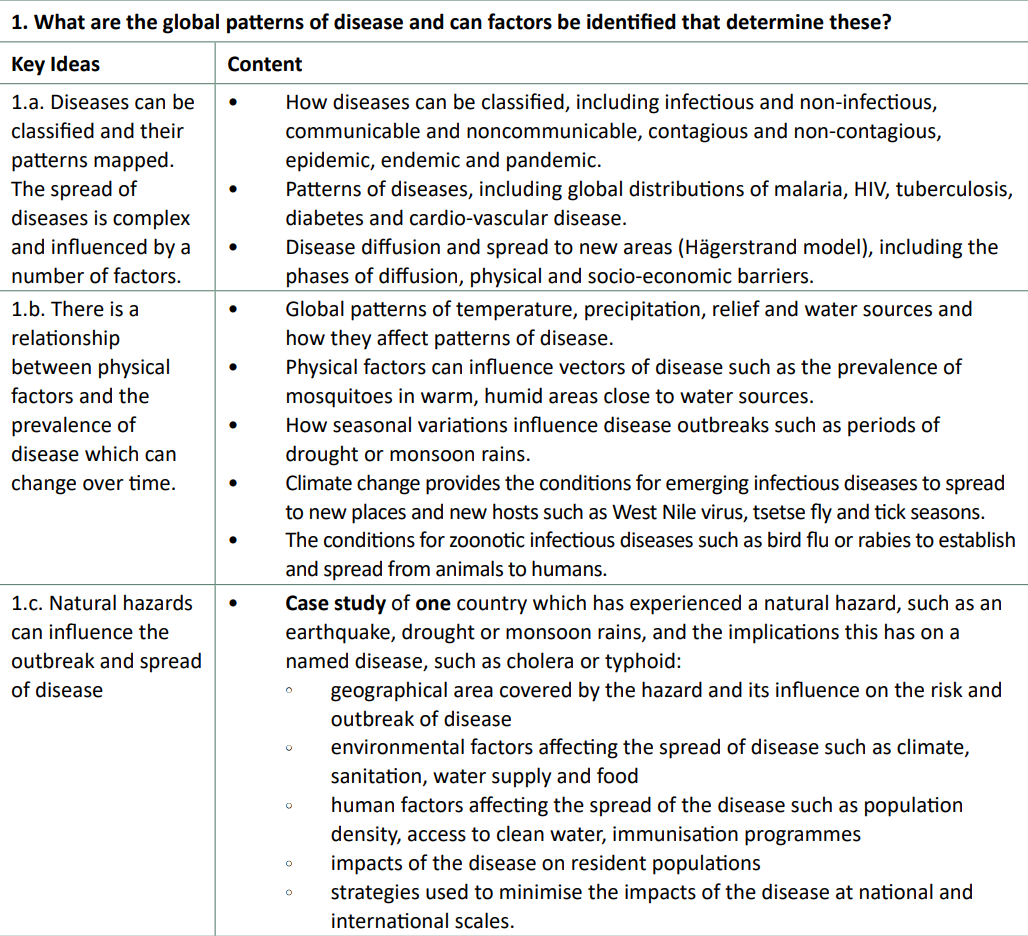
All types of diseases can be categorised into distinct categories depending on how they spread, how frequently they spread, who they spread from and to, and how many people spread them.
Communicable diseases are diseases which spread from host to host through means such as direct contact, contact with contaminated material, through vectors or airborne particles. Broadly, these ones can spread.
Non-communicable diseases cannot be spread between people. These are a result of lifestyle choices and genetic factors
Infectious diseases are those which are spread by pathogens from any host to any host, with any form of contact.
Non-infectious diseases cannot be caused by pathogens between hosts.
Contagious diseases are those which spread between people through direct or indirect contact.
Non-contagious diseases cannot be transmitted from one person to another. However, they may include those transmitted through vectors.
For example:
- Malaria is communicable (can spread), infectious (spread by a parasite) but non-contagious (cannot go directly from person to person)
- Skin cancer is non-communicable (can’t spread), non-infectious (not spread), and non-contagious (can’t be caught from someone else)
In addition, diseases can diffuse in different ways:
- expansion diffusion: increasing in geographical area, typically decreasing in severity
- relocation diffusion: move from one area to another
- contagious diffusion: spread from person to person
- hierarchical diffusion: spread along transport links
All of these are linked to Hargerstrand’s diffusion model.
Be careful when applying this to outbreaks like Covid where the model assumes that people will always want to travel and constant movement. Lockdowns can result in this model’s predictions being broken.
Different scales:
- endemic: persistent in a restricted geographical area
- epidemic: an outbreak that has spread to a larger population
- pandemic: an outbreak that has spread worldwide
2. Is there a link between disease and levels of economic development?
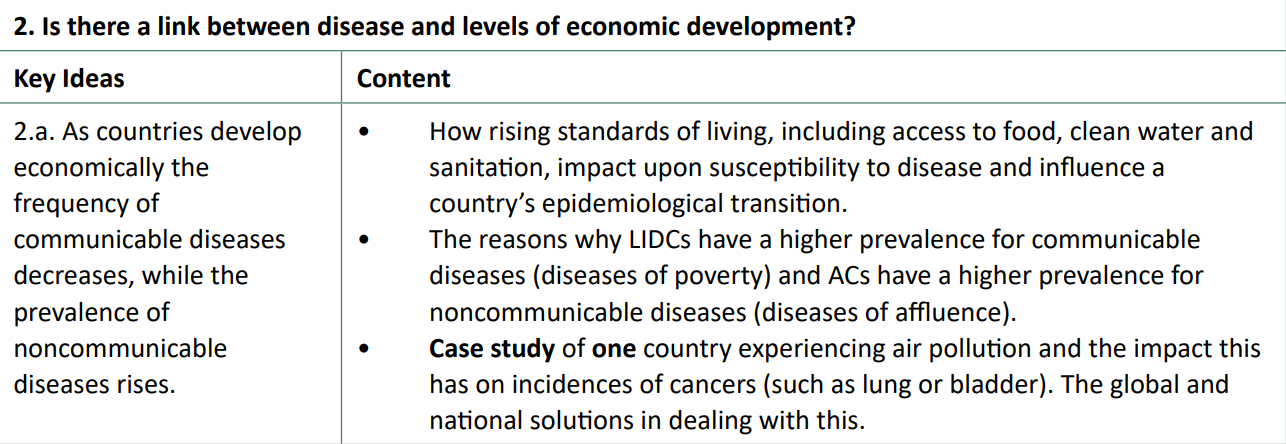
Patterns of diseases
Malaria
Malaria is an infectious, non-contagious disease. It is concentrated around the tropics, mostly in Africa, Central America and South/Southeast Asia - in other words, it is endemic to specific countries and epidemics can occur, but not pandemics. The Anopheles mosquito, which is the fector which transports the Plasmodium parasite, is most abundant in warm and humid environments, but not large urban areas.
Facts:
- In 2018, 220 million people were infected with the disease.
- In total, there are 3.2 billion people at risk in 97 countries.
- It is estimated that half the world’s population since the beginning has died from this disease.
HIV/AIDS
This is an infectious, contagious disease.
Case study: River flooding, Bangladesh
Bangladesh, bordered by India and Myanmar (synoptic link to Global Migration) is a deltaic country, situated on the world’s largest river delta - the Ganges-Brahmaputra Delta.
Flooding from this river is a significant part of the livelihoods of Bangladesh’s population. 60% live in rural areas, mostly in the primary (agricultural) sector; 80% of the land area benefits from the flooding extent. There are several hundred permanent waterways which move around a billion tonnes of fertile soil, fuelled by glacial ablation in the Himalayas (synoptic link to Glaciated Systems) where peak melting coincides with the monsoon season. On top of being low lying (the average elevation is just 9 metres; 10% is below sea level 2, which leads to over a third of the country’s land area regularly flooding in the monsoon season. 1
This isn’t all positive, however. In the short to medium term, climate change is exacerbating risks by increasing the volatility of glacial systems, increasing the magnitude of discharge and therefore magnitude of the flooding in these low-lying areas.

percentage-of-area-inundated-in-Bangladesh
In 2020, the monsoon rains were of unprecedented scale. In the first half of the monsoon season, 40% of the land was inundated. This led to an epidemic of various water-borne diseases, including hepatitis, diarrhoea, typhoid and cholera. Although only 83 people died, 1.3 million homes were damaged (and 3/4 of a million flooded), affecting 5.4 million people (1 in 35 people) 4. The amount of crops destroyed was over 150,000 hectares, 3 which has knock-on effects for future years: consecutive years with bad flooding can decrease communities’ resilience due to less stored money from agriculture, especially true as half of the Bangladeshi population live below the absolute poverty threshold and this can increase the susceptibility to disease outbreaks with a lack of nutrition and strength to be able to fight diseases like diarrhoea which is especially deadly for children under 5 years old. As an LIDC, this is especially true: the population pyramid is swayed in favour of younger ages (5% are under 5, compared to the average in ACs which is 6x fewer). This was seen in Bangladesh with these floods: the contamination of water supplies such as wells resulted in 4,500 people becoming ill with diarrhoea alone. On top of this, just under 2,000 schools and educational facilities were destroyed in the floods too.
Bangladesh, although has its problems, is improving too. The threat of more severe flooding in future years and stronger cyclones has prompted both the government and NGOs to intervene. Female education and nutrition has significantly improved, with an emphasis on breastfeeding which reduces the likelihood of deadly waterborne diseases like diarrhoea being introduced into vulnerable babies’ and children’s immune systems. The Government allocated 14,410 tons of rice to be given to those affected. Oral rehydration solution was given to treat those moderately dehydrated, with water purification tablets being used to treat water supplies in large population centres, significantly reducing the risk of waterborne illness contamination and subsequent infection.
Extra reading available: here
Disease vs Economic Development
Case study: Air pollution and cancer in India
India (Bharat), now the most populous country, is classified as an EDC with an HDI of 0.633 and a GNI of $7130 PPP. However, levels of air pollution in this expansive nation are… pretty bad. 21 of the 30 most polluted cities globally are in India. 99% of Indians breathe air with particulate matter above the WHO’s “safe” levels of PM 2.5 concentrations of less than ten micrograms/m3. With a population of 1.4 billion, half of them are expected to live for three fewer years because of this - and some urban residents in the capital (New) Delhi and other cities like Hyderabad and Gurugram are expected to live for 5 or even 10 or more years shorter!
Over the past 2 decades, fine particle concentration has increased by 69% across India, reducing the life expectancy by around 2.4 years nationally.
Air pollution here is largely caused by particulate matter (PM), like NO2, S02 and O3, emitted from vehicles, factories and coal-based factories. Biomass in rural areas also contributes to this: burning paraffin and animal excrement increases indoor air pollution so much that up to 1 million people die prematurely annually because of this. This is visible as photochemical smog - which can cause acid rain.
PM 2.5 are particulates smaller than 2.5 micrometres in size, which can penetrate and remain persistently in the lungs and interfere with DNA, causing mutations like cancer and increasing the probability of other non-communicable and chronic illnesses. Bronchitis, asthma, lung cancer, and CVDs (heart disease)
In many cities such as Bangalore, around 50% of children suffer from asthma. This is the highest worldwide.
In Delhi, PM 2.5s are at 24x the safe level - and increasing. A reduction to safe levels would benefit life expectancy more than eliminating unsafe water access and eliminating poverty, combined.
Air pollution is having a significant negative impact on India’s economic output and various social factors. There is an added burden on healthcare systems to accommodate for lung cancers and other cardiovascular, chronic illnesses when the country has not fully made it out of the Age of Receding Pandemics (Stage 2) of the epidemiological transition model. The particulate matter at such high levels has an impact on the brain, reducing its function by several percent and potentially reducing educational attainment and the chances of students contributing to the economy through high-skilled employment. Even if they do, the reduced life expectancy will shorten the times they will be able to work, earn, spend and reinvest in the economy.
Nearly 1.67 million deaths and an estimated loss of USD 28.8 billion worth of output were India’s prices for worsening air pollution in 2019. 2
Respiratory diseases are 1.7x higher in Delhi, with a 40% decrease in lung function because of air pollution. In addition, there are 20% more non-smoking-related lung cancer diagnoses each year, with a total of 1 in 68 males being diagnosed with lung cancer in one year alone.
Solutions
However, there is a silver lining to the smog cloud. Gujarat, a state in the west of the country, has set a legal limit on pollutant emissions for industrial plants. The government gives out a set amount of emission permits to companies, and should certain factories require more emissions, they must trade these permits to raise their emissions allowances. This financially incentivises businesses to invest in less emissive processing facilities, reducing air pollution, whilst providing a revenue stream for the local authority to tackle the effects of heightened levels of emissions, in addition to tackling a root cause of this through the trading permits.
Petrol and diesel subsidies have been scrapped in some areas (these fuels power large amounts - 1/3 - of electrical production) and further, 14 Indian cities are expanding the use of high-speed metro systems - encouraging clean, fast public transport which reduces traffic congestion.
In rural areas, zigzag brick kilns which reduce coal consumption by 80% have been fitted in various communities, despite slow progress. Burning stubble in fields - a huge smoke pollutant which wind frequently carries from rural to urban settlements, making up 17% of India’s emissions - is also in the process of having additional restrictions.
Despite all of these advances, the introduction of legislation like this has been slow and there are greater priorities for the moment such as increasing living standards across the country - 15% are still living in multidimensional poverty. There is currently no legislation controlling levels of nitrogen dioxide and sulphur dioxide with vehicle emissions. Economic incentives to further grow the country’s economy may be hampered if legislation like this is forcefully enacted, therefore, the government is betting that allowing significant economic development now will allow them to put laws in place in the future as the country develops, without being of detriment to all citizens.

Further reading: Wikipedia
Global solutions to air problems
In 1997, there was the legally binding Kyoto Protocol. It created agreements on reducing carbon emissions around the world, such as by 2012 there will be 22% lower emissions. In comparison to 1990 in the EU, however, global carbon emissions increased by 65%! Despite this, the goal was achieved and even by 5% in the EU. This caused industries - directly or indirectly - to move and relocate away from the EU. Carbon trading systems were also considered too complex, would not help to reduce emissions, and only included those countries that had already been industrialised.
In 2015, this protocol was replaced by the Paris Climate Convention. It agreed to reduce CO2 emissions below 60% of 2010 levels by 2050 and to keep global temperature rises below 2° C in comparison to the 1900 average. Ideally, this was set to 1.5°, but this is considered too difficult.
Dealing with communicable and non-communicable diseases
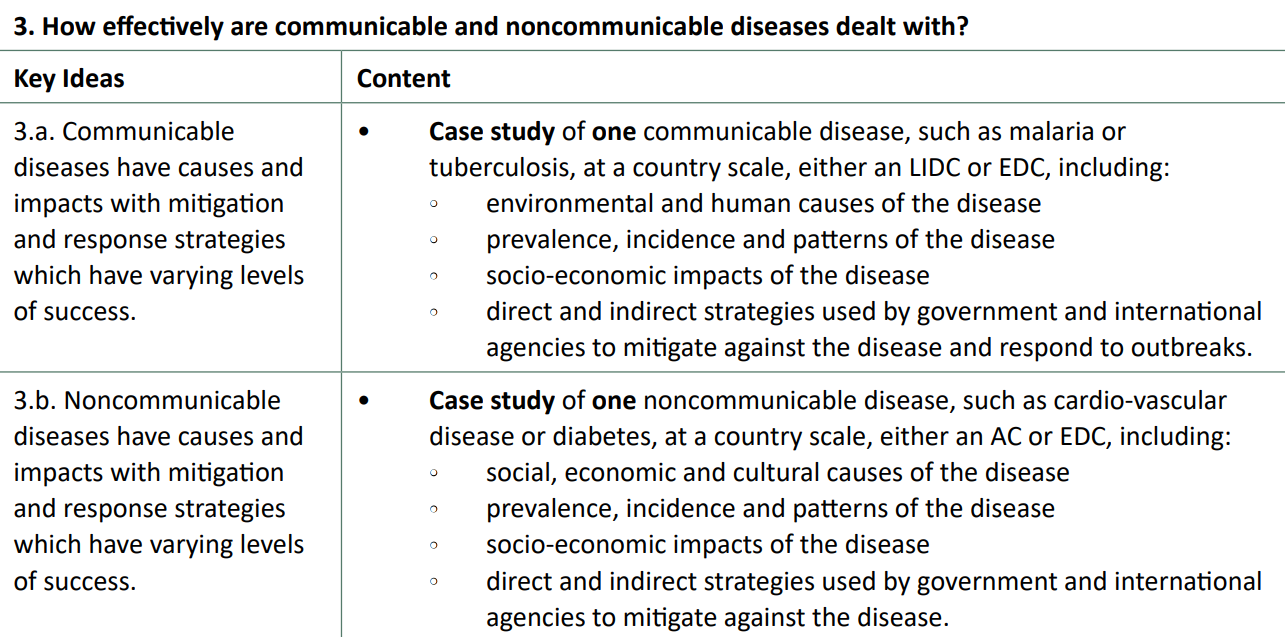
Case study: Malaria in Ethiopia (LIDC)
Malaria, one of the world’s most deadly diseases, is estimated to have killed around 5% of all humans who have ever lived [1]. It is a communicable, infectious but non-contagious disease. More specifically, female Anopheles mosquitoes inoculate the Plasmodium (primary P. vivax) parasite into humans - where it infects liver cells and then moves to red blood cells - with no other known hosts.
Sporozoites inoculated by the female Anopheles vector enters liver cells, rupturing and releasing mature merozoites which move into red blood cells.
200 million cases of malaria were reported in sub-Saharan Africa to the WHO. In Ethiopia, 3/4 of the land area is considered endemic, putting 2/3 of the population (60 million) at risk of contracting the disease, where around 5 million cases are reported, alongside 70,000 deaths, per year. Malaria can also be caught again, as it can take many reinfections to build up sufficient immunity to become protected against it. [2]
The epidemiology of malaria is unevenly distributed. Areas such as the Gambella province, situated to the west of the Ethiopian highland mountains (relief rainfall) is in a lowland area and malaria is endemic. This area, where humid and warm, >30 degrees conditions mix with stagnant water pools provides ideal breeding grounds for mosquitoes (which require >20 degrees C). In the highlands, where altitudes reach over 4,000m are malaria-free thanks to their cooler temperatures. Addis Ababa, the capital, is in a malaria-free area; it is also the 5th highest elevation capital city in the world.
In addition, large-scale population migration occurs at the same time as the rainy season, which is also the season of peak malarial transmission. Many agricultural workers migrate temporarily from the malaria-free highlands to the lowlands. Farmers often sleep in airy barns and work into the night, when transmission is at its highest. Irrigation, in the Awash Valley and in Gambella, has exacerbated the risk of mosquitoes due to more stagnant water pools required to harvest the most common foods like rice.
Socio-economic impacts on Ethiopia
As with all communicable diseases, it is the poor who are the most susceptible and carry the burden of the disease. Malaria accounts for 40% of the national healthcare expenditure and 10% of hospital visits. The cyclical nature of the disease results in particularly bad epidemics every 5-8 years which have been seen to overwhelm health services. On top of this, tourism is stifled from the malaria warnings, despite being a beautiful country along the East African Rift.
The uneven epidemiology also affects food security, the environment and social factors. Addis Ababa is able to accommodate high population densities due to the relatively developed infrastructure and malaria-free state. As people understand the risks of malaria, many refuse to work in the lowlands and overexploit the already poorer quality farmland compared to the nutrient-rich lowlands. It is therefore not surprising to learn that, when harvests are particularly bad with droughts (short-medium term becoming worse due to climate change), the country is susceptible to damaging famines. Economic measures such as DALYs (Disability-adjusted life years) ) lost also show that malaria has a significant impact on the population: 30% of all life years lost are because of this, reducing economic output potential further.
Mitigation strategies and responses
There has been little medicinal development concerning anti-malarial treatments for over 50 years. Chloroquine, which raises the blood pH and therefore that of the parasite, killing it, is becoming increasingly resisted by the parasites and can be toxic for those who take it (socioeconomic impact too). As a result, the government and NGOs have been working together to mitigate the risk of this disease.
The U.S. President’s Malaria Initiative (PMI) has ‘invested’ half a billion dollars into antimalarial programs, such as providing around 50 million insecticide-treated nets (ITNs) to residents, prioritising pregnant women and those under 5. Indoor residual spraying (IRS) has also been used extensively, in over 12 million homes and public places. Child death rates have fallen by over 35%, and 70% of homes now have protection from an ITN or through IRS. In total, the number of malaria-induced deaths has declined by 50% in just 15 years from the peak in 2004. These are some examples of indirect mitigation strategies.
The WHO’s Global Technical Strategy has also targeted Ethiopia as part of a push to eliminate Ethiopia worldwide by 2030, a strategy that worked for Smallpox during the 20th Century. It remains to be seen how growing resistance and increased incidence may have an effect on the longer-term outlook.
Case study: Cancer in the UK
Cancers are non-communicable, non-infectious and non-contagious diseases. One in two people in the UK are expected to suffer from cancer in their lifetimes. One in four people to die in England in 2021 were due to cancer.
Carcinogen: something likely to cause changes to a cell’s DNA. Too many DNA alterations may cause
Rates of cancer in the UK are not evenly distributed. The northeast has the highest rate of colon, lung and rectal cancer, as opposed to areas like London with the lowest rates of cancer in the country, where prostate cancer is highest.
Melanoma, a type of skin cancer, has the fewest cases in more deprived communities according to the Index of Multiple Deprivation compared to lesser deprived communities.
Lung cancer has significantly more (170%) cases in the 50% more deprived communities compared to the least deprived half.
There is a clear link between smoking and at least 15 different types of cancer. 7 in 10 lung cancer cases are caused by smoking; it is also the most common cause of cancer death in the UK
Socio-economic impacts on the UK
A thousand people get diagnosed with cancer in the UK every day. Thousands more get informed that someone they know has been diagnosed. 500 people die daily from cancers. Incidence, in areas dependent of deprivation status, is going to increase by over 40% by 2035 for half a million new cases annually.
The workforce is affected: 120,000 people below the age of 65 are diagnosed every year with cancer. They are likely to leave the labour force for many months at a time during treatment, and many may never return to work - some are too physically in pain or fatigued due to the secondary effects of chemotherapy, for example, to return. The UK has one of the highest rates of carers for those with cancer in the “western” world with over 1 million people caring for someone with a terminal condition, out of work or undergoing treatment. In addition to the 50,000+ working-age people who die to cancer each year, the economic losses of this quickly adds up into the tens of billions, with hundreds of thousands never able to work again.
Mitigation strategies and responses
Environmental factors can explain a large percentage (~ two-thirds) of cancer cases in ACs like the UK. Skin cancer melanoma is increasingly becoming a large risk as people ignore the risks of sunbathing, purchasing sunbeds and buying more accessible cheap holidays abroad - only 11% of people say they always use sunscreen in the UK ([2]). Social media, coupled with increasing wealth and accessibility of products, has idolised the view of a tanned look, whereas in reality unprotected exposure to significant UV rays invisibly damages and ruptures parts of the skin and can interfere with DNA, causing melanoma skin cancer, and reached the highest level in 2023; increasing almost a third in just a decade [1] for an average of 3% per year. To combat this, the Met Office now issue weather warnings and forecasts for UV levels, including for the most popular holiday destinations. The Sunbeds (Regulations) Act 2010 forbids the supply of tanning devices to those under 18. Finally, additional education in schools and publicity campaigns have also been increasingly employed by the government to warn the public about melanoma.
In addition, (international) charities and organisations have employed a range of measures to tackle cancer. Macmillan Cancer Support and Cancer Research UK are some charities that both employ direct and indirect strategies. Firstly, Cancer Research UK invest large sums of their donations into various cancer drugs, and treatments such as immunotherapy, chemotherapy and radiotherapy. The research done in these fields has resulted in many clinical trials which, if successful, can help to detect cancers early and therefore increase survivability. This charity also runs indirect strategies like campaigns to reduce smoking, where a 1% reduction in smoking can save more than 3,000 lives annually. With 150,000 children taking up smoking each year and many continuing for the rest of their lives, they also run educational awareness courses to discourage the uptaking of this habit.
Perhaps the most important organisation involving the mitigation of cancer in the UK is the NHS itself. “Stoptober” campaigns for smoking raise money and make people 5x more likely to permanently quit. £200 million investments are resulting in much faster diagnoses turnarounds - a target of 2 weeks from the GP to the hospital, and 2 months from the GP to treatments commencing. GP training and support have provided access to quicker diagnosis turnarounds, and this is supplemented by screening. Breast cancer screening every 3 years for women aged between 50 and 71, alongside cervical screening at similar intervals for women between 26 and 64 years to catch the most common cancers. Additionally, vaccinations like the Year 8 HPV vaccine have been promoted.
However, the UK NHS system is seen as a “postcode lottery”, not just for cancers but all types of chronic diseases. Covid-19 has amplified and shown the vulnerabilities in such a system, with over 300,000 being on the national cancer waiting list, with 3.1% of these waiting more than 3 months. This is after being diagnosed with cancer! Understandably, this shows that many people’s cancer can progress despite referrals quickly from GPs. due to a lack of hospital availability. For every 4 weeks’ delay in treatment, there is a 10% reduction in complete survival likelihood.
The UK government also employ many indirect strategies. Smoking was banned indoors in 2007, alongside a 2-year increase in legal age, and also picture warnings on smoking packaging - the first EU nation to do so, helping the “tobacco control plan”. “Sugar taxes” have also been introduced throughout the past decade to remove up to 40% of sugar from cereals, banning buy-one-get-one-free offers in supermarkets, and requiring the calorie count to be shown in restaurants. Finally, the 10-year cancer plan with state-of-the-art radiotherapy machines and record investment to reduce the effects of an ageing population. However the effectiveness of these remains limited - the purchase of sweets and unhealthy foods can still be undertaken, and the prevalence of smoking has not seen a substantial decrease since the Covid-19 pandemic, whilst the use of e-cigarettes has increased. Moreover, lack of access to these new technologies in northern areas of the country has been revealed, on top of complaints about “red tape” and additional beaurocracy from importing them.

Predicting and mitigating against diseases
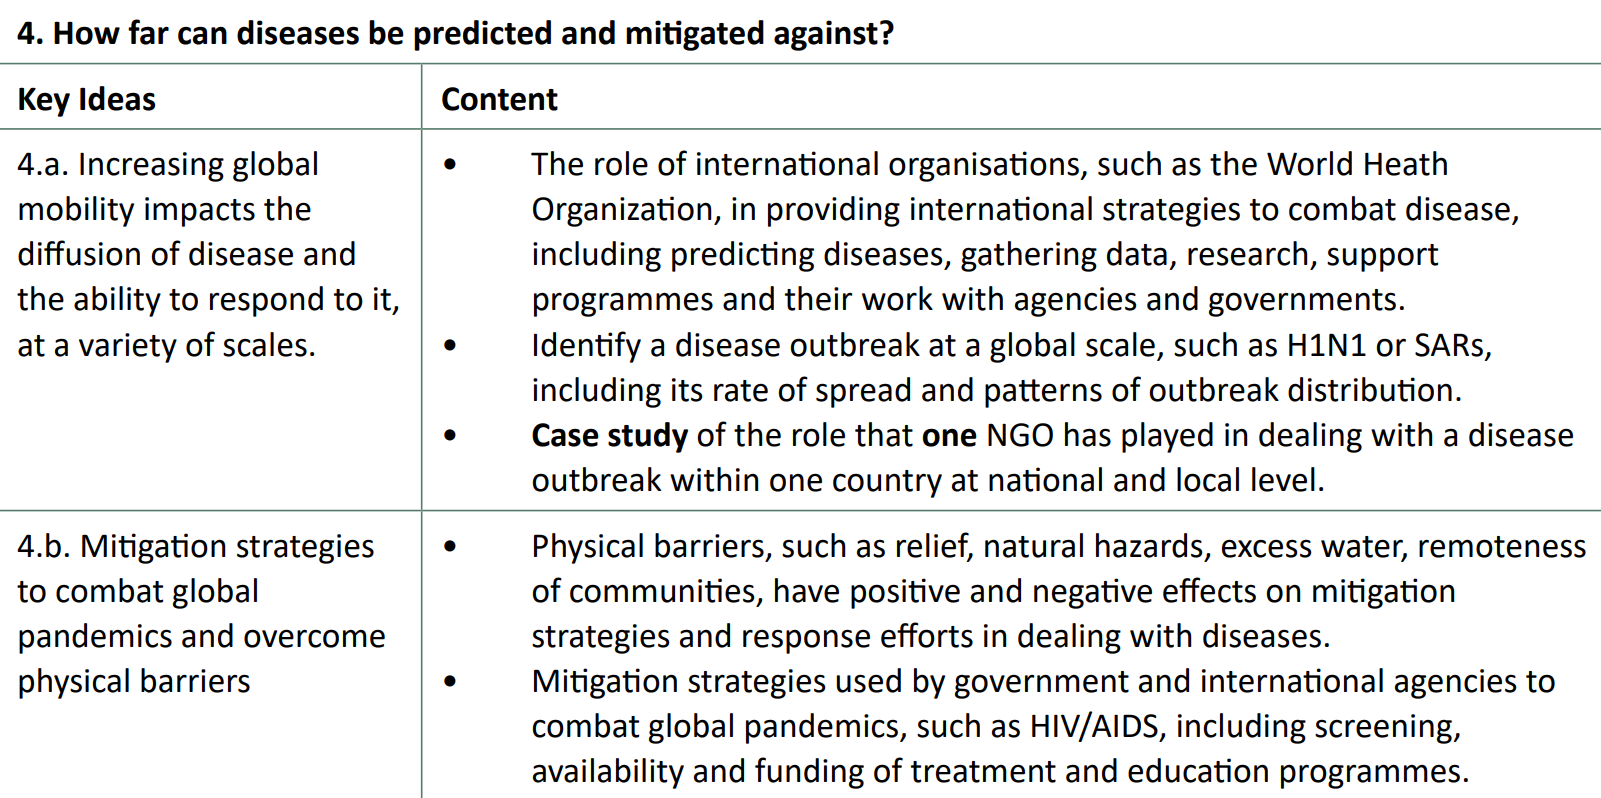
Case study: The Red Cross and cholera in Haiti
Haiti is known as “the poorest country in the Western hemisphere”. It has a GNI per capita of US $1665 PPP and poverty is around 60%. The Mw 7.0 quake in January 2010 killed around 10% of the population of the capital, Port-au-Prince. More than 90% of the population lived in slums and half had no access to toilets.
Nepalese aid workers stationed along Mirebalais, in the Artibonite river valley, are believed to have brought the disease, 9 months after the quake hit the island nation. 820,000 cholera cases were counted within 4 years, with around half a million hospitalisations - 82 hospitals had been damaged or destroyed during the quake.
The British Red Cross targeted the outbreak with its own response programme between 2010 and 2012. 10 days after the outbreak began, MSF found that the largest camp in P-a-P had no access to chlorinated drinking water, and the Red Cross were able to deliver clean water to 300,000 cap dwellers in the capital. On top of this, as cholera is water-borne, they built 1300 latrines, serving almost 200 people each. They also directly treated over 20,000 cholera cases in treatment units across Haiti, provided medical supplies to hospitals in the Artibonite Valley and also indirectly combatted the disease through educational measures, teching how to avoid infection and the symptoms.
Coupled with other aid workers like Cuban doctors who treated more than 75,000 cholera cases, it may have been a much greater success than it was. Weak governance contributed to the poor treatment of cholera in Haiti. There were over 10,000 NGOs but no effective management strategy and as a result, the easily-treated cholera was responsible for 10,000 deaths. [1]. Basic functionality and sanitation was not put in place across the country.
Further reading: [www.ncbi.nlm.nih.gov
Can diseases ever be fully eradicated?
Case study: the rosy periwinkle

Plants have been used for a long time as medicines to cure diseases, from old herbal remedies in prehistory to the medieval Doctrine of Signatures.
The rosy periwinkle (or rosy p) leaves contain 70 alkaloids with significant medicinal value. Vincristine and vinblastine were preciously undiscovered by science. Vincristine is being used in childhood leukaemia: since 1970, survival rates have increased from 10% to 90%. Vinblastine can help testicular cancer, Hodgekin’s lymphoma and more. Furthermore, other alkaloids can be used to treat some cancers too. This has been unable to be synthesised synthetically through scientific means.
In Madagascar, where it is native, and in some areas of India and central Asia, huge land areas are being used to farm this plant. For Eli Lilly, its developer, sales equate to hundreds of millions of dollars from healthcare services around the world.
However, it is patented by Eli Lilly, which makes it illegal for others to sexually reproduce, import or export the plant. As a result, it maintains a monopoly over the periwinkle market and can effectively charge the prices they decide to use it. Furthermore, this also allows them to get away with biopiracy, as under 5% of the money is given back to the indigenous farmers. Economic growth is limited due to export restrictions under Lily which can exacerbate poverty in a region, as workers are effectively being exploited for transnationals’ gain.
Although it has come under scrutiny from some EU regulators, this practice largely goes unnoticed, as pharmaceutical companies have leverage and spend billions on discovering new drugs.
Biopiracy further reading: here
Case study: GSK (formerly GlaxoSmithKline)
GSK is part of the transnational pharmaceutical industry, which is a for-profit industry.
Historically, GSK has been (and may still be) overcharging governments and individuals for drugs, making abnormally high profits on lifesaving therapeutics. Its former employees have been criminally prosecuted on two continents, and have also been accused of lobbying governments and international organisations, with the use of bribing medical experts in favour of them. In addition, they have been seen to prioritise the R&D of drugs that require long repeated prescriptions and less those which are not as profitable like those needed for tropical diseases.
Despite these criticisms, GSK is able to deliver almost a billion vaccine doses and billions of medicine packs and healthcare products every year. 100,000 people globally are directly employed by them in tertiary and quaternary sector jobs, improving local economies in their 36 countries of manufacturing.
Some of GSK’s breakthroughs and patents include the first malaria candidate vaccine and ongoing Nobel Prize-winning discoveries for malarial drugs. They also provide medication for type 2 diabetes and discovered the first oncology drug for leukaemia. On top of this, they are one of the only pharmaceuticals to be actively researching new candidate drugs for the WHO’s top 3 global priority diseases. Patents in medicine last for no longer than 20 years and gives GSK the ability to invest greater amounts in new medicines. They currently hold almost 10,000 patents, largely in HIV medication, cancer treatments, cardiovascular disease and Covid-19.
As GSK had an operating profit of £6.433 billion in 2022, they are able to afford to provide LIDCs and EDCs drugs and medicines at significant discounts: 80% of the 800mn vaccine doses given were to these countries in 2014. In addition, they do not enforce historic patents or file new medicinal patents in LIDCs, allowing companies to manufacture versions of their medicines in these countries. FInally, their code of practice now involves capping the prices of patented drugs in LIDCs, many of which cannot manufacture their own pharmaceuticals, to 25% of the UK price and only allowing a 5% return on each product sold - the remaining 20% of its profits are invested into the developing country where it is sold.
Mini case study: Guinea worm in Ghana
The Guinea worm eradication programme and the Ghana Red Cross women’s program partnered and women, who are typically the ones to source water for families, were taught about the benefits of filtering water to avoid contamination. Women were also responsible for reporting and monitoring all cases of the worm back to the WHO.
Note: Although not a case study, grassroots strategies should also be recapped (guinea worm)
[tbd] Hazardous Earth
3-marker limitation questions
To answer these questions, firstly understand what the question is asking. For example:
“Identify three limitations of Fig. 5 (graph) as a source of information about earthquakes occurring in Iran.”
This is effectively asking about how well it is a source of information about earthquakes. Therefore your answer must be about earthquake information and that’s it. Therefore, you should consider the properties of earthquakes, their effects, responses and more. For example, does the figure:
- Not contain essential information? This could be the magnitude, focus, people affected by it, why that specific location. If it is a map, why that area? Geology?
- Have a completely understandable scale? Pick out a year/month and can you get a precise reading? Is it going up in regular, precise intervals or random numbers of years?
- Have a reliable source? Is it from the USGS, the UNDRR, the EU?
- If statistics give, question why. Is it a raw number, or a more accurate proportion? Why is it just from one country - may it be beneficial to compare multiple?
Theory of Plate Tectonics
The theory of plate tectonics is closely linked with Alfred Wegener’s theory of continental drift, a theory completed in 1912 but rejected by scientific communities.

Reasons for plate movement
Paleomagnetism
Paleo (fossilised) magnetism is the record of historic magnetic changes as the Earth’s polarity changes (known as geomagnetic reversals), with recent polarity inverses occurring every 200 to 300 thousand years. When oceanographers mapped seabeds during WW2, magnetic flips were observed on either side of divergent boundaries and seafloor spreading centres. This is because when magma is erupted, it has high iron content. These iron particles within the erupted lava then cool quickly as a result of the water, solidifying the surrounding lava and preserving a record of the magnetic direction the iron was pointing in. There is a mirror image of the polarity inversals on either side of the plate boundary.
Glacial deposits
Evidence from previous glacial periods when the Pangea supercontinent existed reinforced the idea that at one point, land masses were connected. Striations, lines in rocks carved by glaciers moving other rocks over them, have been found by glaciologists in central India, Africa and even in the Amazon Rainforest.
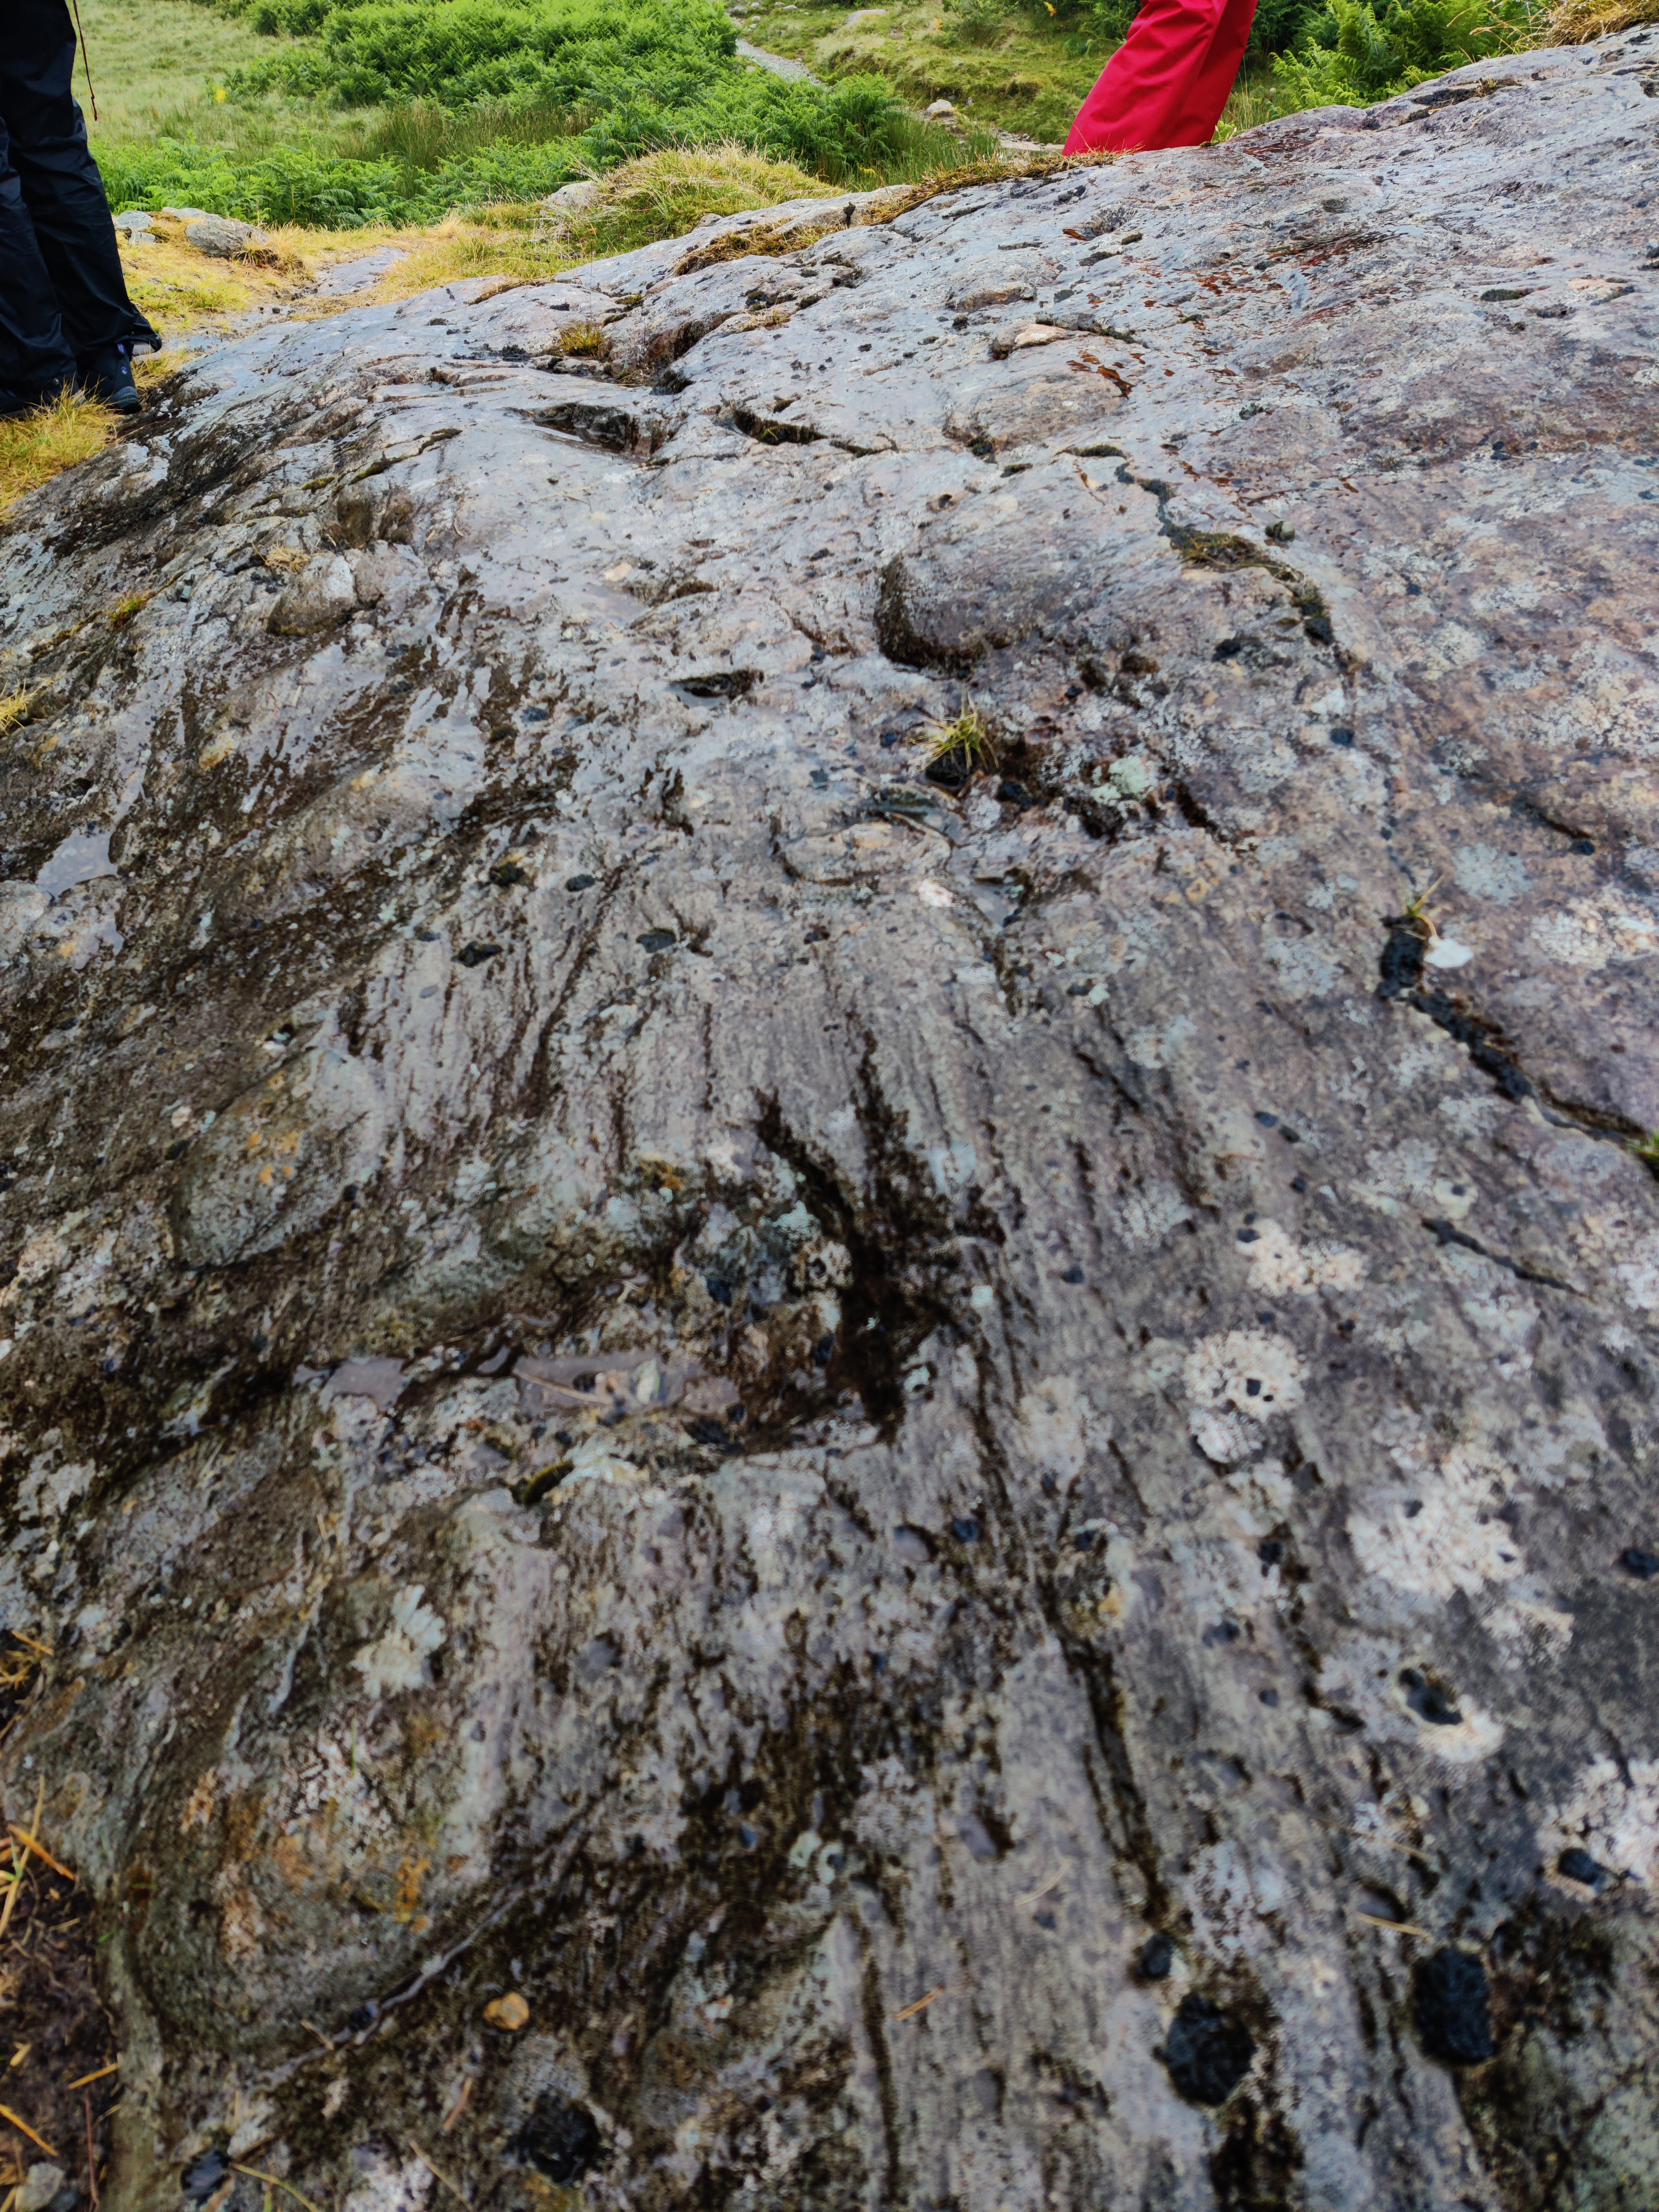
Striations and spherical laval bombs visible in a roche moutonnée near Easedale Tarn, Lake District. Credit: me
Apparent fit of the continents
He noticed that the continents looked just like pieces of a broken puzzle…
Geologic sequences
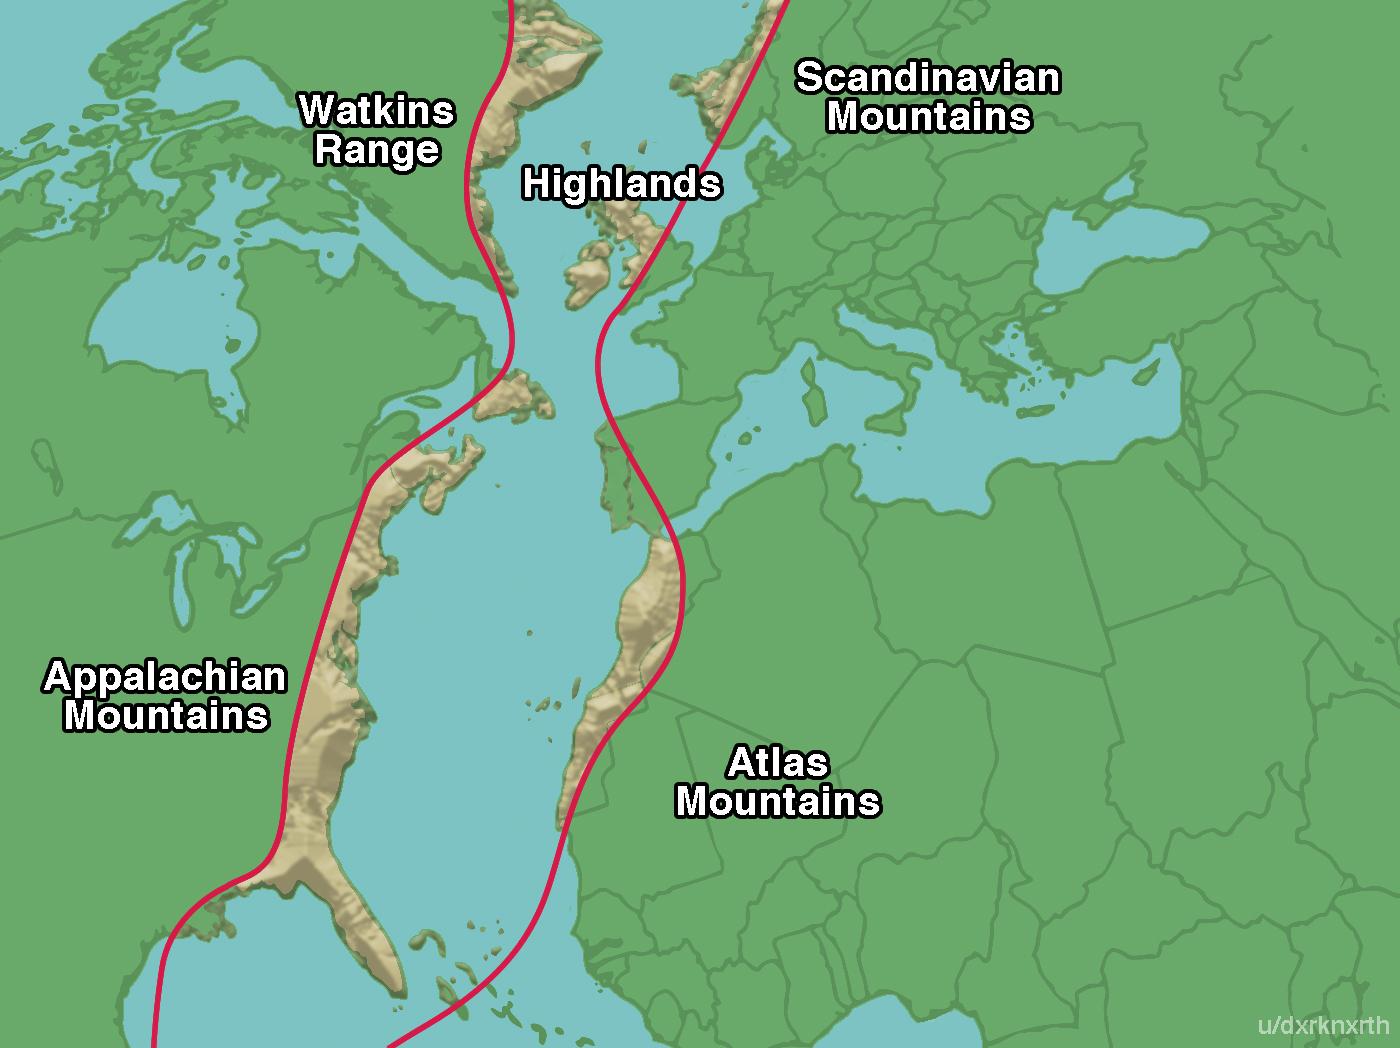
*A slightly exaggerated visualisation of the present-day positions of the Appalachian Mountain range. Thanks to Dark North (u/dxrknxrth) and this Reddit post!
Fossil evidence
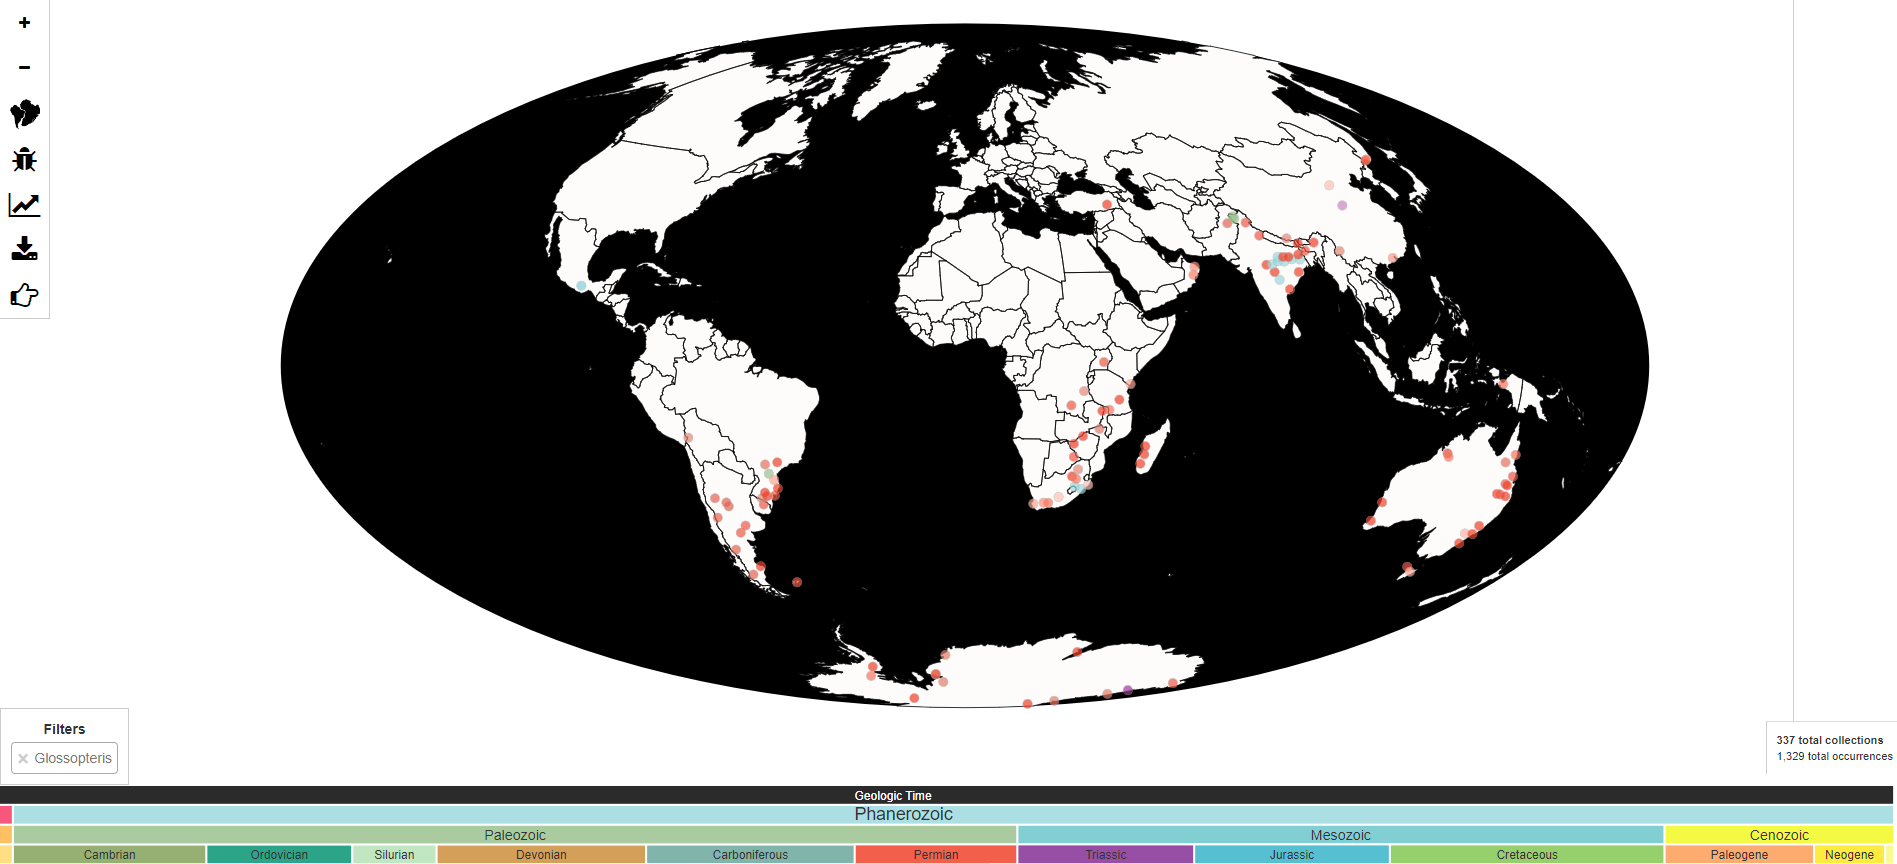

Plate Boundaries
A plate boundary is where two plates meet. This is not the same as there being two plate boundaries! There is only one boundary and two plates.
Divergent plate boundaries
At a divergent plate boundary, two plates move apart from each other. Depending on the rate of movement and type of and density of the lithospheric crust, different landforms can be found
Oceanic-oceanic boundary
At a mid-oceanic ridge, molten magma rises towards the Earth’s surface, thanks to hot magma plumes within the mantle, originating from the lower mantle. As magma rises - caused by the force of the mantle plume - and enters the asthenosphere, it loses pressure and cools down. The lithospheric rocks above are pushed upwards by force, fracturing the lithosphere and penetrating through the crust. Accompanied by ridge push, at these ridges, thermal expansion from the presence of magma causes the surrounding rocks to… expand. Over time, vast chains of underwater mountains up to 3km tall and 60,000km in total length have formed.
At these oceanic ridge crests, landforms which are likely to be visible include black smokers (hydrothermal vents) where seawater meets the hot magma, as well as pillow lavas, which are mainly basaltic. These rocks once cooled can be used to indicate the upwards orientation at the time of eruption.
Variations in seafloor spreading velocity result in lateral transform faults, which appear as zig-zags on topographic ocean maps. Due to the accumulating pressure and tension as these masses move, small earthquakes will likely occur due to the releasing of kinetic energy. (There is little volcanic activity along transform faults.)
A transform fault is only the lateral part of the zig-zag, between ocean ridge crests.
Continental-continental
In locations where two continental plates meet (such as the East African Rift: Nubial <–> Somali), the mantle plume is not as strong, if any at all. As a result, rift valleys are created and are visible on land (such as in Iceland). These form as the plates, being pulled away from each other due to convection currents fuelling slab pull, resulting in the land at the boundary sinking: there is nothing below supporting it. Volcanic fissures also may open up for a time if there is land movement and a magma chamber beneath, which look like lines of magma erupting over a landscape. Shield volcanoes erupt viscous lava and are less active compared to composite volcanoes and calderas.
Rift valleys can also be found where spreading is occurring at a slower rate, such as the Mid-Atlantic Ridge (North American <–> Eurasian) on land such as Iceland.
Convergent plate boundaries
- upthrust of lithospheric rock creating high altitude fold mountains e.g. Himalayas on continental-continental. Big, shallow focus earthquakes
- responsible for deep ocean trenches e.g. Mariana and Java Trench on continental-oceanic and oceanic-oceanic boundaries
- oceanic plate subducts, melting in the asthenosphere. As a result there is explosive volcanic activity, and shallow focus earthquakes, tsunamis and most dangerous boundary
- oceanic-oceanic also forms island arcs. Antilles and Aleutian
(explain from memory)
Conservative plate boundaries
Typically continental plates move past in a strike-slip shearing motion.
No crust destroyed, no magma created, no volcanoes
However there are very big earthquake potenial
(explain from memory)
Conservative boundaries are also referred to as transform plate boundaries (wording in the USA only)
Volcanoes
The chemistry of an eruption
The nature of a volcanic eruption is shaped by a range of factors. For example, the viscosity, or the ‘stickiness’ of magma. The viscosity measures the resistance to flow an, in the case of volcanic activity, the more viscous it is, the more explosively the eruption may be.
Additionally, the gas inside the magma chamber drives the flow of the magma through the mantle and crust. Gas can build up within the magma chamber, forcing the magma to be quickly discharged and causing a more explosive eruption. Other factors can include the pipe’s shape. The length and diameter of it can cause differing explosion types, with typically short, narrow pipes creating greater explosions.
Magma is made of molten rock crystals which grow as the liquid inside cools down. Gas bubbles can make this more porous, viscosity and chemistry of the melt and temperature can change the characteristics of magma. The chemistry of magma refers to the polymerisation state of the liquid. Remember GCSE chemistry? Polymers are long chains of molecules; if these contain silica and oxygen inside, it become more viscous. Acidic, rhyolitic lava is characteristic of this chemistry, from typically converging boundaries.
Alkaline and H2O molecules break up these polymers into smaller, simple molecules which flow more easily and are typically basaltic.
To simplify the remembrance of the formation and type of magma, have a look at this table and see if you notice a pattern.
| Explosive eruptions | Effusive eruptions |
|---|---|
| Typically forms at converging boundaries | Typically forms at diverging boundaries or hotspots |
| Formed as a result of subduction | Formed from a deep mantle plume, or from ridge pull |
| Temperatures cooler, at around 750 | Hot temperatures at 1000+ degrees |
| Sticky, viscous magma | Runny, low viscosity magma |
| Acidic | Less acidic |
| Cannot travel far, builds up a distinctive cone around a volcano | Travels far and fairly flat, a ‘shield’ shape. You may not know it is a volcano at all. |
| Rhyolitic magma | Basaltic magma |
| Distinct central vent and perhaps several side vents | Fissure eruptions common |
| Less unpredictable but infrequent | More unpredictable, but more frequent |
| Recurrence intervals can range from several years to several thousand+ years | Recurrence intervals are very frequent, even once per day |
| Examples include Mt Pinatubo, Mt. St. Helens, | Examples include Iceland, Hawaii |
Intrusive volcanicity
Hotspot volcanoes
Yellowstone supervolcano
Stratovolcanoes
Cone-shaped formed by explosive extrusive volcanicity. Due to high viscosity, typically near a converging boundary, caused by long-length silica-rich acidic polymers due to the mixture of hot asthenospheric material and subducted plate debris which contains H2O, gases and other material from the ocean floor. This results in more gases developing, rising upwards and mixed in viscous, relatively cool (~600-800 degrees C) rhyolitic magma chambers. The explosive eruptions occur when the magma pushed by gases reaches the surface. The high viscosity causes the lava to not travel long distances. Over time, ash and lava will solidify in strata, building up around the central volcanic funnel causing the characteristic dome shape.
Shield Volcanoes
Effusive, basaltic eruption causes these as low-length polymerisation of the lava allows for higher temperatures (>1000degrees) and less viscosity, enabling long-distance transport after the initial extrusion.
East African Rift Valley
The African Plate is splitting in two! Land is dropping down due to ridge push and convection. There are also volcanic mountains
Volcano Case Studies
- Mitigating the event is a costly method of reducing the effects of an eruption as it is occurring - e.g. ash wall construction and lowering concrete barriers from helicopters in Etna, spraying water on lava to cool and slow it down in Iceland
- Mitigating against vulnerability is preparing the community and planning for hazards to occur. Indonesia’s Centre for Volcanology and Geological Hazard Mitigation is… [tbd]
- Managing losses is how the event is responded to. Well-trained search and rescue teams and temporary shelter provisioning are perhaps key to reducing the impact of an eruption. EDCs such as Indonesia may be the most adept to dealing with these.
Case study: Eyjafjallajökull, Iceland
Iceland, in 2010, had a HDI of 0.92 and a GNI per capita of US$36,270 PPP, with a life expectancy of 82.
Eyjafjallajokull is a stratovolcano covered in glacial ice. Volcanic events starting in March 2010 began effusively, with characteristic basaltic andesitic lava. This attracted some tourists to the area, and ash reached no more than 4km in the atmosphere - a VEI 2 eruption.
In April 2010, the second, most significant explosive eruption occurred, peaking at a VEI of 4. This was particularly damaging for many reasons. It was directly below the very stable jet stream, pushing wind towards the UK and Europe. The eruption took place under 200m of glacial ice, with much of the meltwater flowing back into the caldera increasing the explosivity with high gases and increased pressure. This also caused glass-rich ash to be formed quickly which was injected into the troposphere at above 10km in altitude, which moved its way along Western and Central Europe.

Impacts on people
Many farm crops and roads were washed away from glacial jökulhlaups, and fish exports from the Icelandic offshore fishing industry were halted due to the ash. Around 800 nearby residents were evacuated from large trucks and members of the fire brigade. Because of good infrastructure, warning systems and education, there were no direct deaths from the eruption.
On the continent, over 100,000 flights were cancelled, affecting 7 million passengers exacerbated by the Easter school holiday season. It is estimated that the GDP loss of the entire EU from this was $2.6bn with airlines losing $1.7bn. This had a knock-on effect for those reliant on the tourism industry, which is highly volatile and depends on revenue during these periods. London lost over £102mn and some companies were never able to recover from this. On top of 400,000 Britons stranded globally due to the three major London airports being closed - almost 1% of the population - this was particularly damaging.
Just-in-time manufacturing and trade as a result of globalisation such as the transport of Kenyan flowers cost the horticultural industry around $3mn per day, with 5 thousand flower and vegetable farmers who rely on a source of stable income in LIDCs being temporarily laid off. (97% of flowers are delivered to Europe, which is difficult when the whole airspace is closed!)
“Volcano tourism” has increased sharply since the eruption, with people going to visit the geological landforms and effusive activity like lava streams across the country. Tourist levels were 43% above forecast levels, with almost 80,000 additional visits. These people spend an average of ~$2000 each, generating significant revenue for the country.
“The increase in Icelandic tourism was far greater than the previous decline caused by the natural disaster and greatly exceeded forecasts.” [1]. This clearly shows how it can be a benefit to countries which can successfully mitigate against vulnerability, losses and the event itself.
How to pronounce
Case study: Volcan del Fuego, Guatemala
Guatemala is an LIDC in Central America with an HDI of 0.627 and GNI/capital of $8,500 PPP.
The eruption in 2018 was Guatemala’s deadliest event since 1902. It killed over 200 people with a VEI 3-4 plume reaching 15.2km. There was no hazard plan, and despite being one of the most active volcanoes along the Pacific Ring of Fire, it seems that people did not fully understand the risks. Bodies in 6 destroyed villages were found not far from homes, corroborating with video footage of people simply staring at the ash cloud and oncoming pyroclastic flows. Coupled with the fact that there was no evacuation alert issued, this shows that the infrastructure and investment were simply inadequate in the region.
Efforts to evacuate the area were rendered difficult due to inaccurate data involving road access, population size and population locations in proximity to the volcano’s flanks prone to pyroclastic flows. The Guatemalan Mountain Rescue Brigade were already searching for a missing person when explosive activity increased, and were able to help a significant but unknown number of people in surrounding villages to evacuate, emphasising the need for well-trained and experienced individuals for mitigation of vulnerability. Mitigation of losses could have been better but was not totally inadequate: firefighters were immediately deployed to the area with the aim of recovering trapped people and bodies, however, the heat and nature of the pyroclastics simply incinerated many buildings. 6,000 people were eventually evacuated as lava flows continued into the night and temporary shelters were provisioned with priority given to women and children, showing that there was at least some emergency provisioning.
Case study: Mount Nyiragongo, DRC, May 2021
Mountain Nyiragongo is situated on a continental divergent plate boundary, resulting in effusive eruptions. The world’s largest lava lake is situated in the volcano, which is a cinter cone, and it began to grow and show increased activity. However, the Goma Volcano Observatory was unable to successfully pay for Internet connections to remotely monitor the volcanic activity on instruments, or staff fuel to take measurements due to a withdrawal of World Bank funding due to allegations of government corruption one year prior. Goma is the provincial capital city of 2,000,000 inhabitants around 15 kilometres to the South.
As a result, only one warning was issued for an imminent eruption a fortnight preceding the May eruption. Three vents opened on the cinder cone’s flanks, which flowed towards Goma at a rate of around 1 kilometre per hour, allowing around 20 hours for people to escape. Around 30 two people died, mostly used to asphyxiation - the invisible, toxic CO2 gathers in low-lying areas. Whilst there was an evacuation warning of 400,000 people as a result of the city evacuation plan and a third of the population moved quickly, 2000 homes were destroyed and 17 villages were ruined.
However, this LIDC eruption was much better handled compared to the eruption in 2002, where 10x more people died and 13% of the city was destroyed, rendering 120,000 homeless. People in Goma were evidently more prepared this time, showing how far a small warning system and prior community knowledge can help mitigate vulnerability.
Case study: Mount Merapi, Indonesia
Indonesia is an EDC with an HDI of 0.705 and GNI per capita of $4,580 in 2022. It is in a very unstable tectonic region, with the Sunda Trench being the subduction zone between the Indo-Australian plate to the south and east, and the continental Eurasian plate to the north. There are 130 active volcanoes in Indonesia and, as a result, 70% of the 273 million inhabitants live within 100km of an active volcano - within range of damaging distances to historic VEI 6 and 7 eruptions of Tambora and Krakatau. 8.6 million are within 10km of these volcanoes - the range of a pyroclastic flow.
Quick facts:
- Eruption occurred in October 2010. Peak VEI of 4 - deadliest in 150 years
- 353 people died, mostly due to close proximity pyroclastic flows
- 350,000 evacuated from the areas in hazard zones 1, 2 and 3
- Many people returned as the eruption was still ongoing. It lasted over a month from 25th October to the end of November
50,000 people are living on Mt. Merapi’s slopes, within the most dangerous hazard Zone 3. This is primarily due to the agricultural benefits of volcano flanks:
- Ash deposits are rich in potassium and phosphorous. Combined with added relief rainfall and being in a tropical equatorial region, there is plenty of water to supply large swaths of agricultural regions
- Infrastructure such as electricity and telecommunications already exists in the region, reducing the amount of pull factors to move into urban regions such as Yogyakarta to the south.
- However, although risk perception is high, it may have been overridden by a sense of dependence on the land - they may not have a financial buffer compared to when Eyjafjallajokull erupted with the same VEI in the same year.
Mitigation strategies have been partially successful. The local Javanese government compensated many thousands of farmers with plots of land elsewhere to discourage the continued inhabitation of the flanks.
Indonesia has very well-prepared, experienced and equipped emergency services. In addition, there is a constant clearance of flood and river channels to reduce the impact of lahars, which were seen, especially due to the Equatorial nature of the country, and pyroclastic flows might have on the population, of which there were over a dozen during Mount Merapi’s eruption in 2010. In addition, local governments have been able to provide hundreds of thousands of people with emergency shelters, some of which end up becoming permanent settlements, which are much futher away from the volcano itself, mitigating vulnerabilities further. However, despite this apparent organisation, the shelters are also prone to disease outbreaks. The “mass exodus” of people who the shelters have been occupied by have historically has involved many children becoming severely injured and separated from their parents and their families. Despite allegations of corruption, local governments’ responses during national disasters remain excellent, including aid delivery from both internal and external means.
Despite the local government’s demonstration of regularly clearing valleys from debris, there can be no replacement for ensuring that people are moved away from the stratovolcano’s flanks and provided access to another area - something which has been done for those in zone 3. However, for an EDC with some of the fastest-growing populations and high population densities supporting 1,000/km2 even in remote areas of Java, a balance seems to have been struck by successfully modifying the vulnerability to a large extent whilst not investing huge amount of money to save less and less residents who do simply do not wish to move.
Strategies to manage volcanic hazards
Mitigating against events
Humans cannot stop volcanic hazards
Mitigating against vulnerability
Modifying loss
NEA stuff
Spearman’s Rank
In the first sheet, in cell E5, you write:
=RANK.AVG(C5,$C$5:$C$24,0)
This compares the value of the cell in C5 to those in cells 5 to 24.
You then go to the bottom right of the cell and drag the dot to cell E24
This will copy that earlier formula to give the results for each row. This is because we need the results in an ordered format.
Repeat this for the Cancer rate column (so =RANK.AVG(D5,$D$5:$D$24,0)) in column F
Finally, in any other cell, we can use the cool excel CORREL function to just work it out
=CORREL(E5:E24,F5:F24)
This gets the spearman’s correlation for the two sets of data
Footnotes
(Disclaimer) AI-assisted writing
ChatGPT or any other text-based generative transformer model was not used to directly write the content here. It’s good for clarification of certain topics (and I’ve used it for that), but don’t get used to it otherwise you’ll lose your creativity.
To add later:
Development of Dubai time-lapse [interactive]